Counties with the highest rates of strokes in Pennsylvania

- Death rate for ischemic strokes, 2018-20: 21.7 per 100K people
- Death rate for hemorrhagic strokes, 2018-20: 9.6 per 100K people

- Death rate for ischemic strokes, 2018-20: 15.6 per 100K people
- Death rate for hemorrhagic strokes, 2018-20: 12.1 per 100K people

- Death rate for ischemic strokes, 2018-20: 15.8 per 100K people
- Death rate for hemorrhagic strokes, 2018-20: 7.9 per 100K people

- Death rate for ischemic strokes, 2018-20: 16.1 per 100K people
- Death rate for hemorrhagic strokes, 2018-20: 8.1 per 100K people

- Death rate for ischemic strokes, 2018-20: 16.1 per 100K people
- Death rate for hemorrhagic strokes, 2018-20: 9.1 per 100K people
You may also like: Best places to raise a family in Pennsylvania

- Death rate for ischemic strokes, 2018-20: 16.5 per 100K people
- Death rate for hemorrhagic strokes, 2018-20: 8.3 per 100K people

- Death rate for ischemic strokes, 2018-20: 16.6 per 100K people
- Death rate for hemorrhagic strokes, 2018-20: 8.5 per 100K people
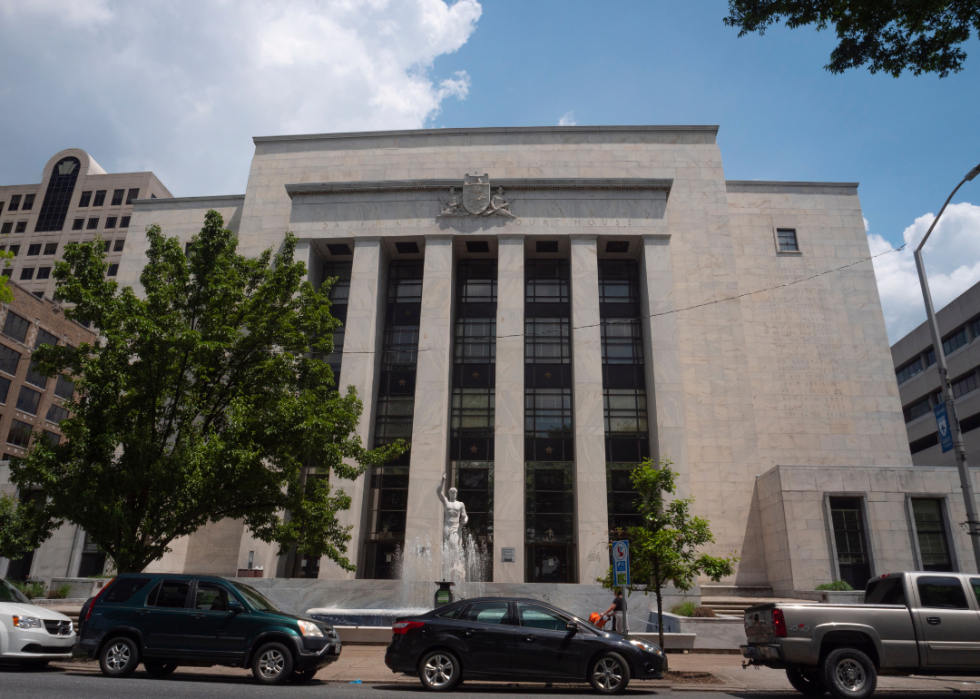
- Death rate for ischemic strokes, 2018-20: 16.6 per 100K people
- Death rate for hemorrhagic strokes, 2018-20: 8.8 per 100K people

- Death rate for ischemic strokes, 2018-20: 17.4 per 100K people
- Death rate for hemorrhagic strokes, 2018-20: 8.1 per 100K people

- Death rate for ischemic strokes, 2018-20: 17.4 per 100K people
- Death rate for hemorrhagic strokes, 2018-20: 8.2 per 100K people
You may also like: Highest-rated breweries in Pennsylvania

- Death rate for ischemic strokes, 2018-20: 17.6 per 100K people
- Death rate for hemorrhagic strokes, 2018-20: 9.0 per 100K people

- Death rate for ischemic strokes, 2018-20: 18.7 per 100K people
- Death rate for hemorrhagic strokes, 2018-20: 9.0 per 100K people

- Death rate for ischemic strokes, 2018-20: 19.1 per 100K people
- Death rate for hemorrhagic strokes, 2018-20: 9.1 per 100K people

- Death rate for ischemic strokes, 2018-20: 20.0 per 100K people
- Death rate for hemorrhagic strokes, 2018-20: 7.9 per 100K people

- Death rate for ischemic strokes, 2018-20: 20.1 per 100K people
- Death rate for hemorrhagic strokes, 2018-20: 9.1 per 100K people
You may also like: Highest-rated football recruits from Pennsylvania over the last 20 years

- Death rate for ischemic strokes, 2018-20: 15.0 per 100K people
- Death rate for hemorrhagic strokes, 2018-20: 8.2 per 100K people

- Death rate for ischemic strokes, 2018-20: 15.1 per 100K people
- Death rate for hemorrhagic strokes, 2018-20: 8.6 per 100K people
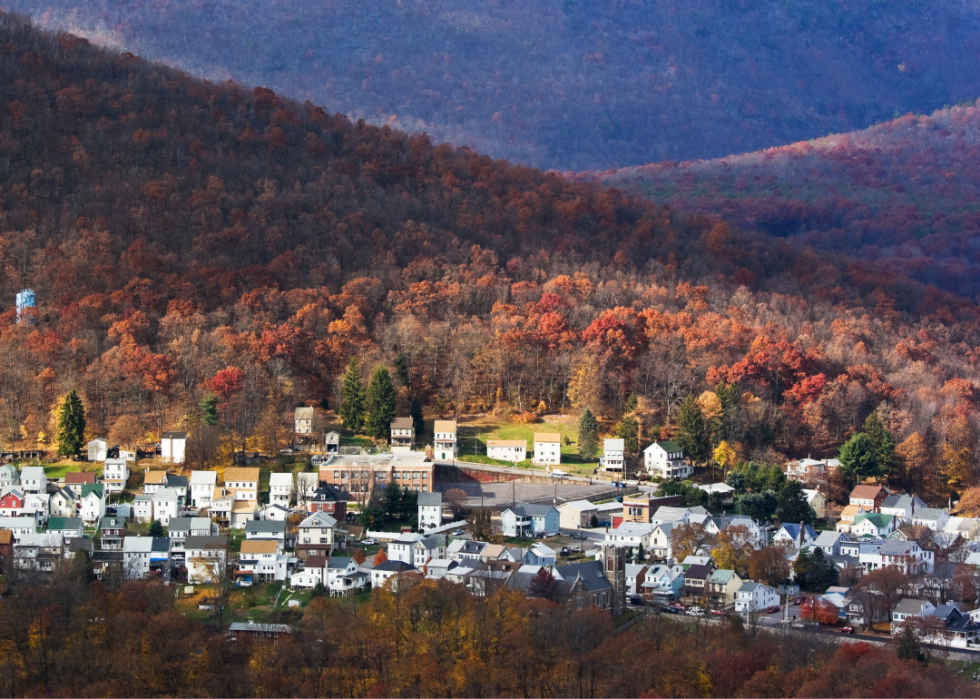
- Death rate for ischemic strokes, 2018-20: 15.9 per 100K people
- Death rate for hemorrhagic strokes, 2018-20: 8.3 per 100K people
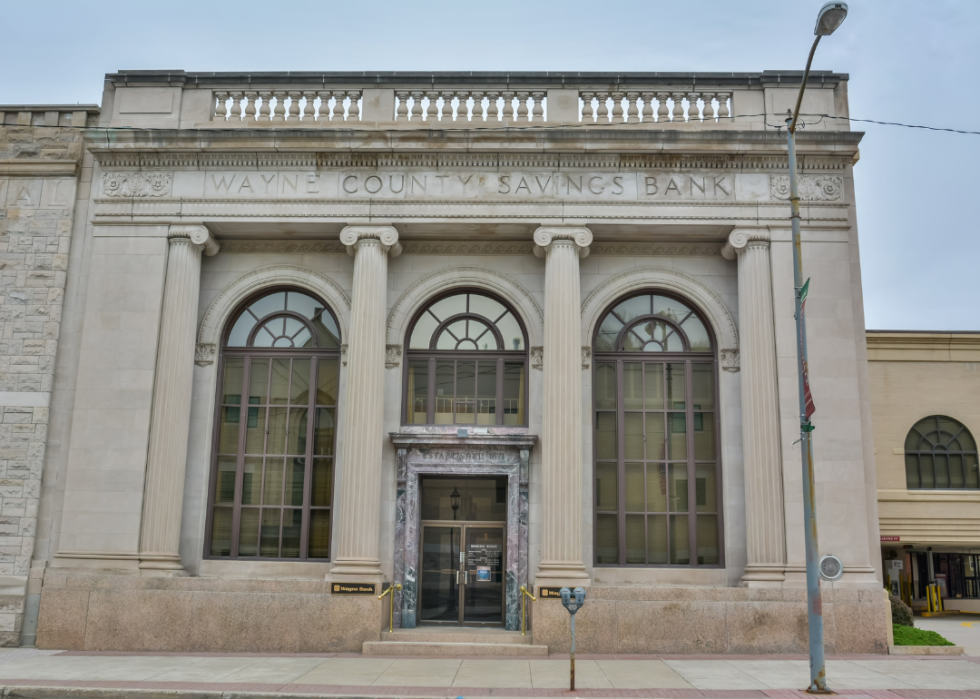
- Death rate for ischemic strokes, 2018-20: 16.0 per 100K people
- Death rate for hemorrhagic strokes, 2018-20: 8.2 per 100K people
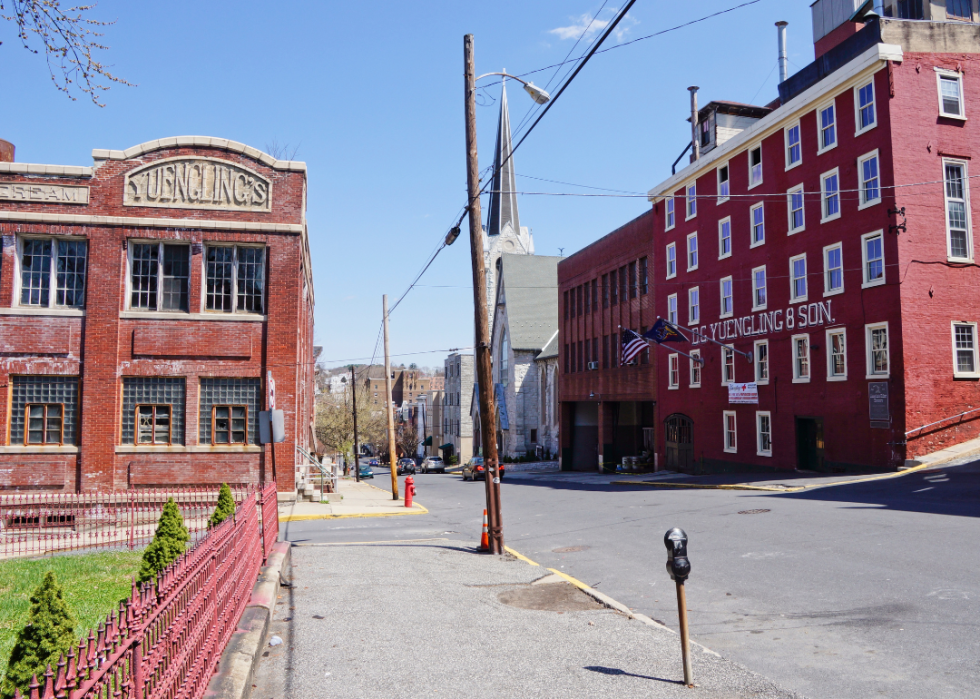
- Death rate for ischemic strokes, 2018-20: 16.0 per 100K people
- Death rate for hemorrhagic strokes, 2018-20: 9.2 per 100K people
You may also like: Counties with the oldest homes in Pennsylvania

- Death rate for ischemic strokes, 2018-20: 16.2 per 100K people
- Death rate for hemorrhagic strokes, 2018-20: 8.2 per 100K people

- Death rate for ischemic strokes, 2018-20: 16.2 per 100K people
- Death rate for hemorrhagic strokes, 2018-20: 8.3 per 100K people

- Death rate for ischemic strokes, 2018-20: 16.4 per 100K people
- Death rate for hemorrhagic strokes, 2018-20: 9.5 per 100K people

- Death rate for ischemic strokes, 2018-20: 16.9 per 100K people
- Death rate for hemorrhagic strokes, 2018-20: 8.7 per 100K people

- Death rate for ischemic strokes, 2018-20: 17.0 per 100K people
- Death rate for hemorrhagic strokes, 2018-20: 8.7 per 100K people
You may also like: Counties with the lowest hospital bed capacity in Pennsylvania
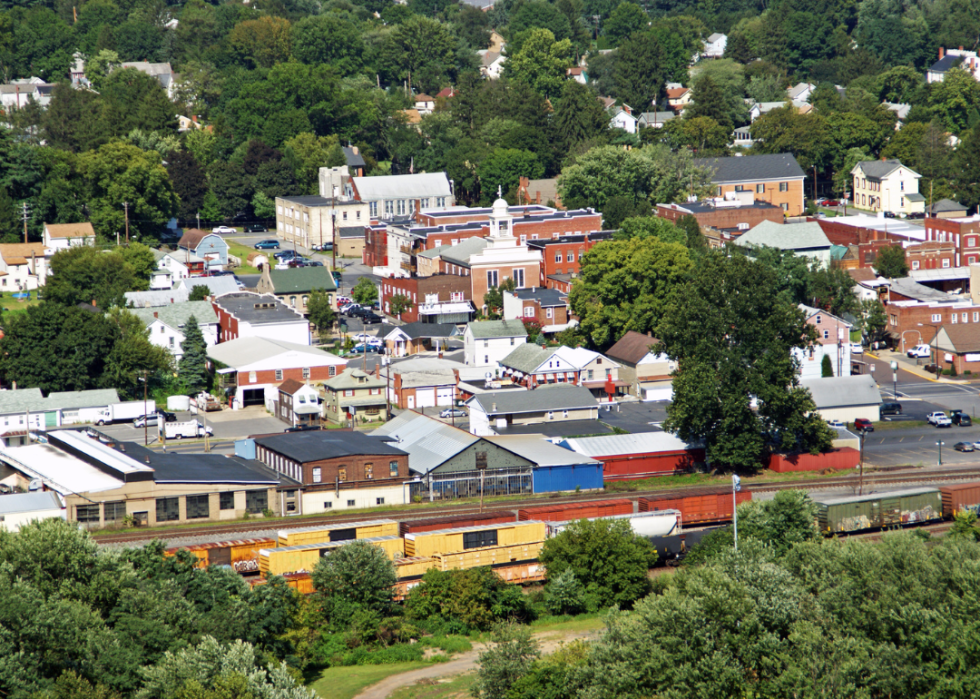
- Death rate for ischemic strokes, 2018-20: 17.1 per 100K people
- Death rate for hemorrhagic strokes, 2018-20: 8.5 per 100K people

- Death rate for ischemic strokes, 2018-20: 19.0 per 100K people
- Death rate for hemorrhagic strokes, 2018-20: 9.2 per 100K people

- Death rate for ischemic strokes, 2018-20: 19.3 per 100K people
- Death rate for hemorrhagic strokes, 2018-20: 7.9 per 100K people

- Death rate for ischemic strokes, 2018-20: 19.5 per 100K people
- Death rate for hemorrhagic strokes, 2018-20: 9.0 per 100K people

- Death rate for ischemic strokes, 2018-20: 19.7 per 100K people
- Death rate for hemorrhagic strokes, 2018-20: 9.3 per 100K people
You may also like: Famous actresses from Pennsylvania

- Death rate for ischemic strokes, 2018-20: 19.8 per 100K people
- Death rate for hemorrhagic strokes, 2018-20: 9.3 per 100K people

- Death rate for ischemic strokes, 2018-20: 19.8 per 100K people
- Death rate for hemorrhagic strokes, 2018-20: 9.5 per 100K people

- Death rate for ischemic strokes, 2018-20: 20.7 per 100K people
- Death rate for hemorrhagic strokes, 2018-20: 9.8 per 100K people

- Death rate for ischemic strokes, 2018-20: 21.0 per 100K people
- Death rate for hemorrhagic strokes, 2018-20: 7.7 per 100K people

- Death rate for ischemic strokes, 2018-20: 21.1 per 100K people
- Death rate for hemorrhagic strokes, 2018-20: 9.5 per 100K people
You may also like: See how much of its wind energy potential Pennsylvania uses

- Death rate for ischemic strokes, 2018-20: 23.0 per 100K people
- Death rate for hemorrhagic strokes, 2018-20: 9.0 per 100K people

- Death rate for ischemic strokes, 2018-20: 15.4 per 100K people
- Death rate for hemorrhagic strokes, 2018-20: 8.9 per 100K people

- Death rate for ischemic strokes, 2018-20: 16.6 per 100K people
- Death rate for hemorrhagic strokes, 2018-20: 7.4 per 100K people

- Death rate for ischemic strokes, 2018-20: 16.6 per 100K people
- Death rate for hemorrhagic strokes, 2018-20: 8.8 per 100K people

- Death rate for ischemic strokes, 2018-20: 16.9 per 100K people
- Death rate for hemorrhagic strokes, 2018-20: 8.6 per 100K people
You may also like: Highest NFL draft picks from Pennsylvania

- Death rate for ischemic strokes, 2018-20: 17.0 per 100K people
- Death rate for hemorrhagic strokes, 2018-20: 8.6 per 100K people

- Death rate for ischemic strokes, 2018-20: 18.3 per 100K people
- Death rate for hemorrhagic strokes, 2018-20: 8.8 per 100K people

- Death rate for ischemic strokes, 2018-20: 20.0 per 100K people
- Death rate for hemorrhagic strokes, 2018-20: 9.6 per 100K people

- Death rate for ischemic strokes, 2018-20: 23.7 per 100K people
- Death rate for hemorrhagic strokes, 2018-20: 8.8 per 100K people

- Death rate for ischemic strokes, 2018-20: 25.5 per 100K people
- Death rate for hemorrhagic strokes, 2018-20: 8.6 per 100K people
You may also like: What Pennsylvania's immigrant population looked like in 1900
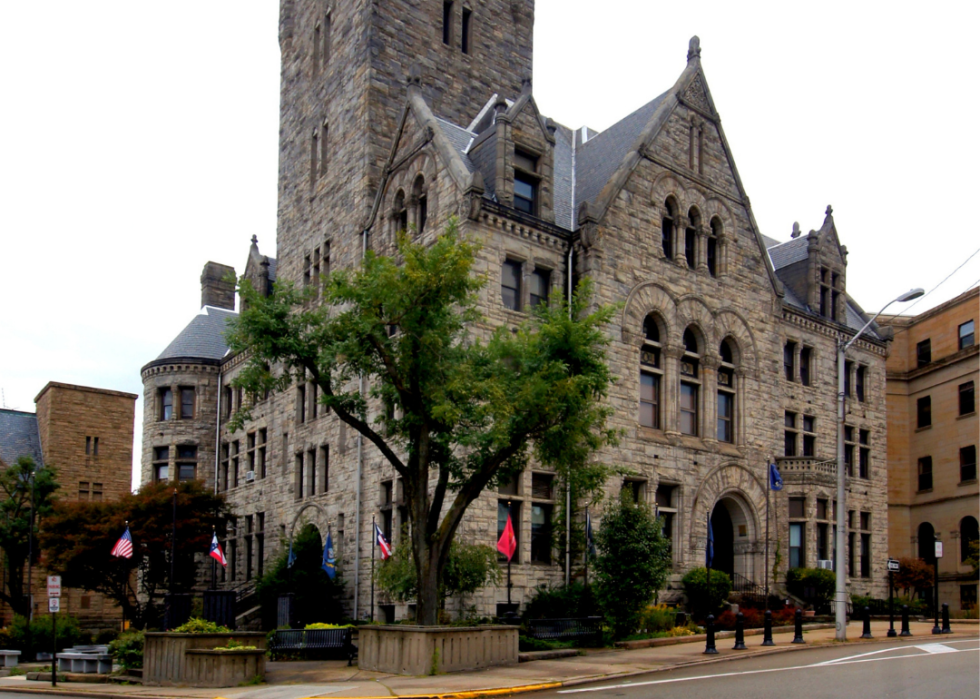
- Death rate for ischemic strokes, 2018-20: 18.3 per 100K people
- Death rate for hemorrhagic strokes, 2018-20: 8.8 per 100K people

- Death rate for ischemic strokes, 2018-20: 14.2 per 100K people
- Death rate for hemorrhagic strokes, 2018-20: 8.2 per 100K people

- Death rate for ischemic strokes, 2018-20: 17.9 per 100K people
- Death rate for hemorrhagic strokes, 2018-20: 8.6 per 100K people

- Death rate for ischemic strokes, 2018-20: 20.6 per 100K people
- Death rate for hemorrhagic strokes, 2018-20: 9.6 per 100K people

- Death rate for ischemic strokes, 2018-20: 19.5 per 100K people
- Death rate for hemorrhagic strokes, 2018-20: 10.9 per 100K people
You may also like: Highest-earning cities in Pennsylvania
This story features data reporting and writing by Emma Rubin and is part of a series utilizing data automation across 49 states.
