Prices are rising fastest in these US metros
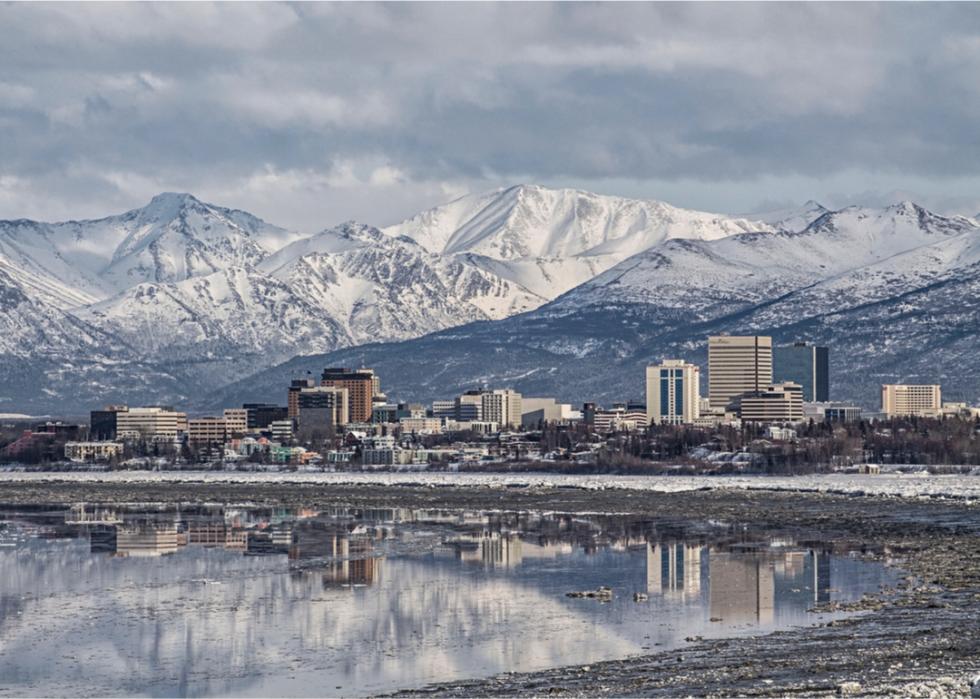
- Annual inflation, H1 2023: 2.2%
--- 2.7 percentage points below the national city average
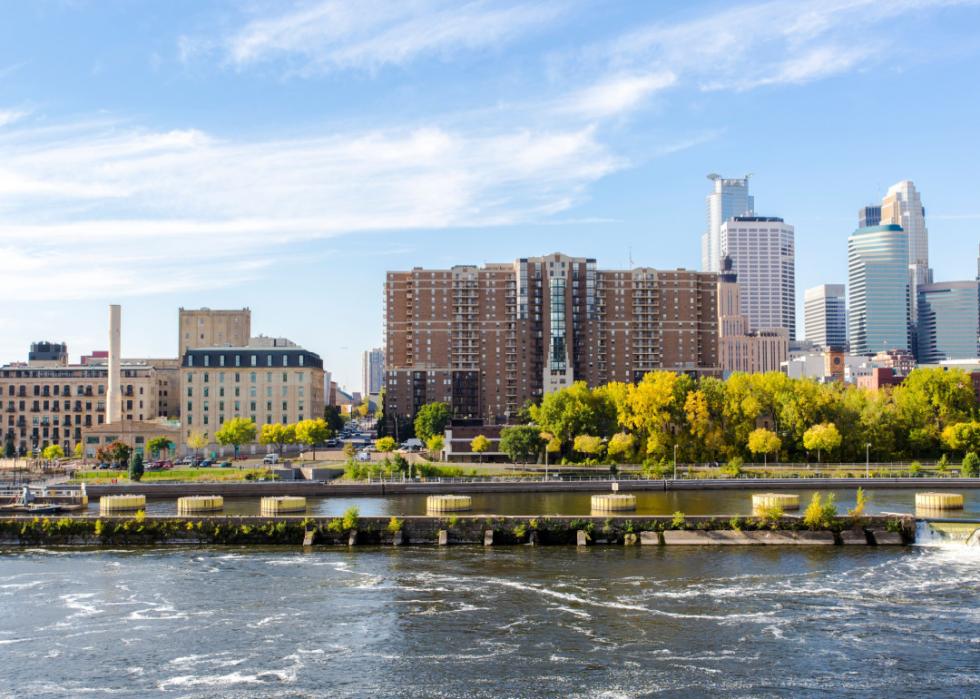
- Annual inflation, H1 2023: 3.2%
--- 1.7 percentage points below the national city average
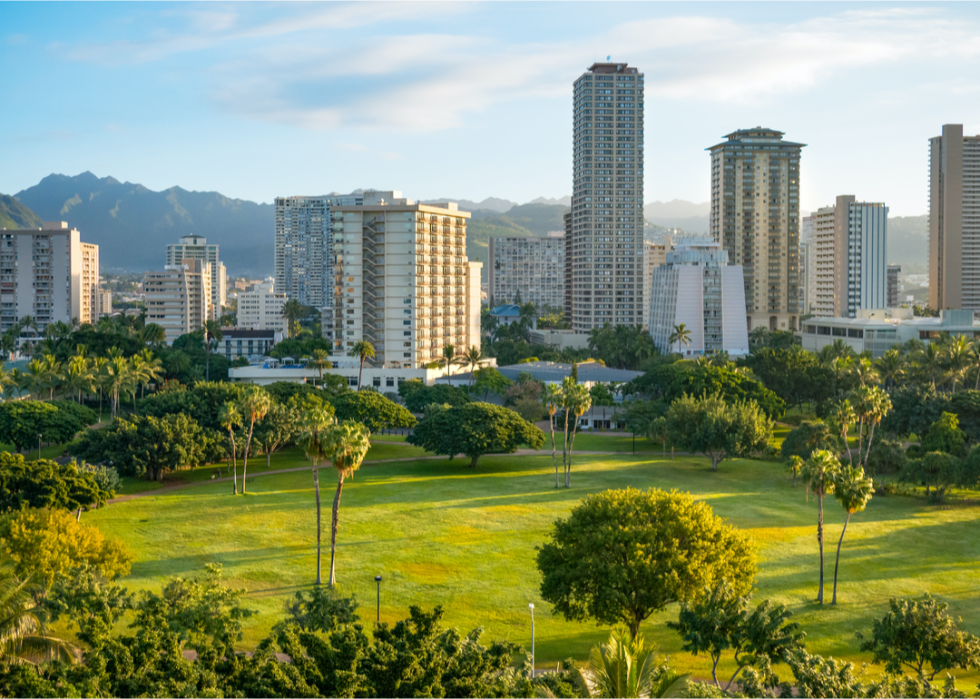
- Annual inflation, H1 2023: 3.4%
--- 1.5 percentage points below the national city average

- Annual inflation, H1 2023: 3.5%
--- 1.4 percentage points below the national city average

- Annual inflation, H1 2023: 3.8%
--- 1.1 percentage points below the national city average

- Annual inflation, H1 2023: 4.0%
--- 0.9 percentage points below the national city average
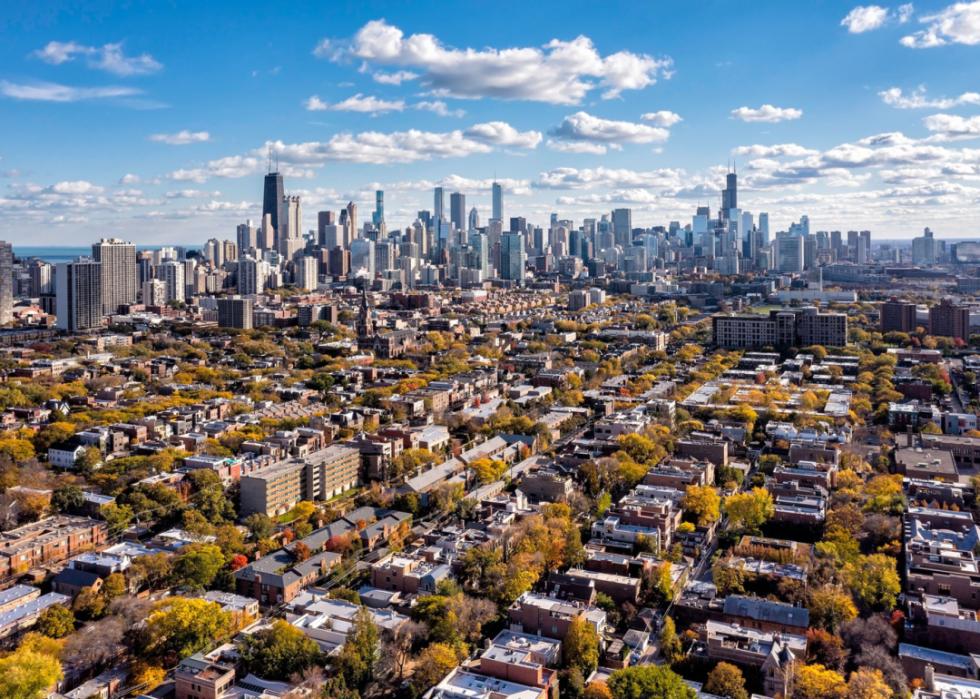
- Annual inflation, H1 2023: 4.1%
--- 0.8 percentage points below the national city average

- Annual inflation, H1 2023: 4.4%
--- 0.5 percentage points below the national city average

- Annual inflation, H1 2023: 4.4%
--- 0.5 percentage points below the national city average
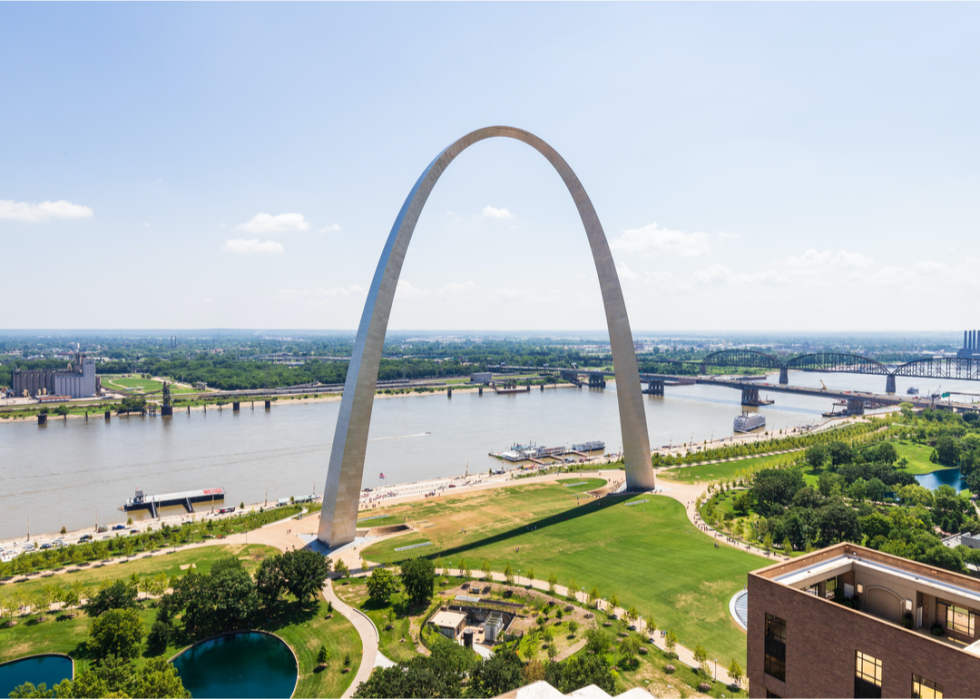
- Annual inflation, H1 2023: 4.6%
--- 0.3 percentage points below the national city average
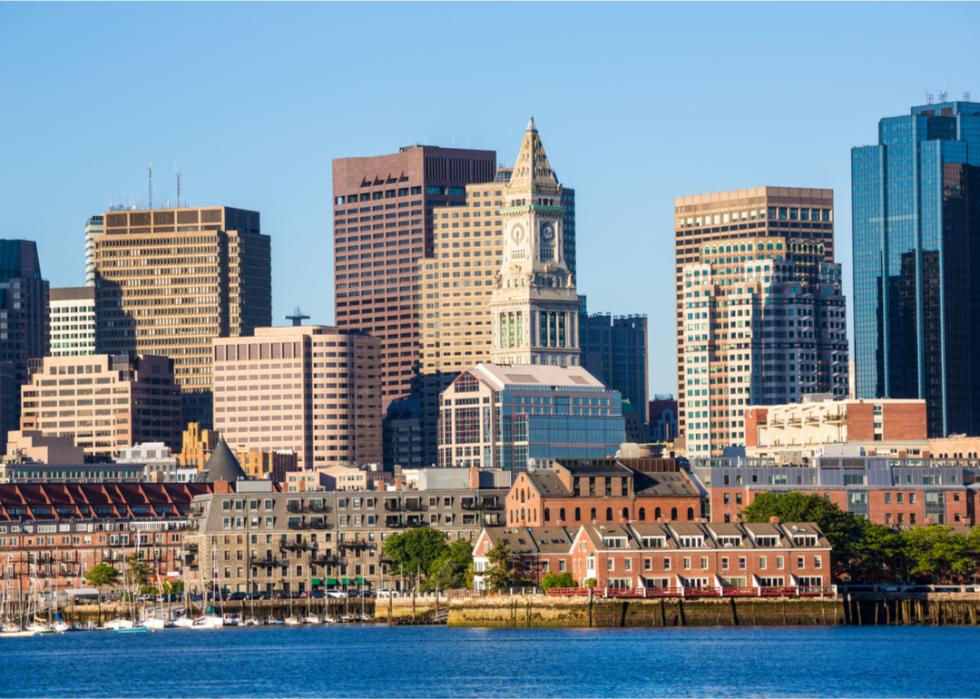
- Annual inflation, H1 2023: 4.7%
--- 0.2 percentage points below the national city average

- Annual inflation, H1 2023: 5.0%
--- 0.1 percentage points above the national city average
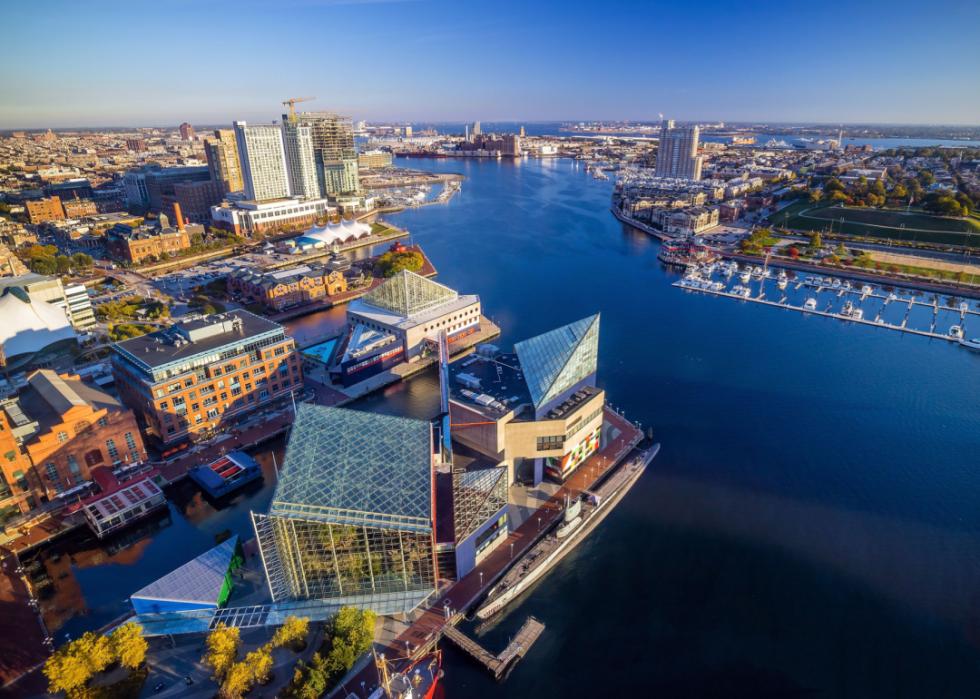
- Annual inflation, H1 2023: 5.0%
--- 0.1 percentage points above the national city average

- Annual inflation, H1 2023: 5.1%
--- 0.2 percentage points above the national city average

- Annual inflation, H1 2023: 5.5%
--- 0.6 percentage points above the national city average
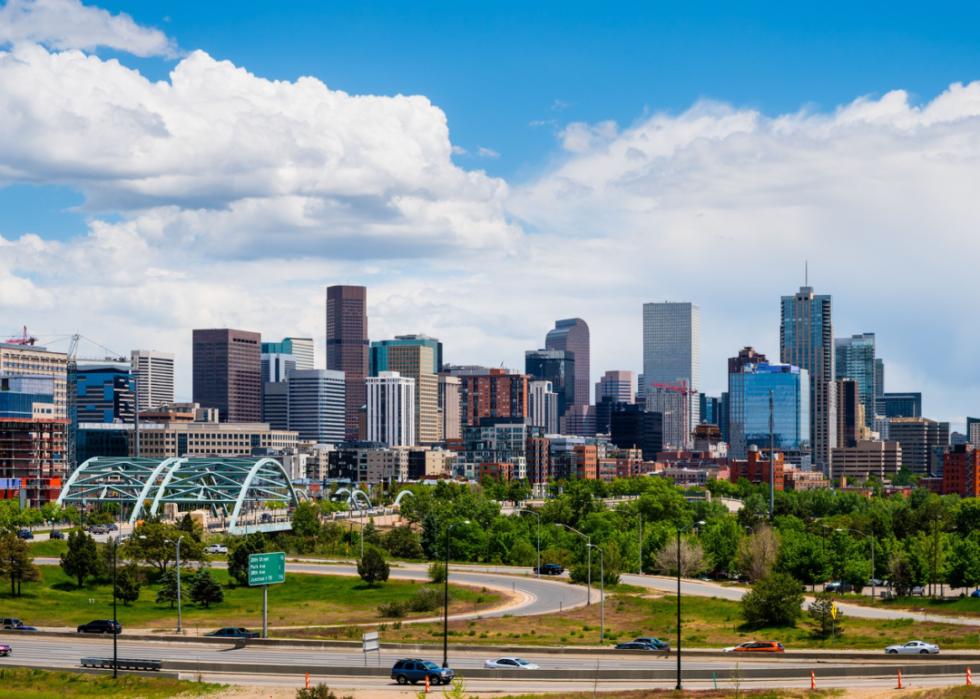
- Annual inflation, H1 2023: 5.6%
--- 0.7 percentage points above the national city average

- Annual inflation, H1 2023: 5.7%
--- 0.8 percentage points above the national city average

- Annual inflation, H1 2023: 6.1%
--- 1.2 percentage points above the national city average
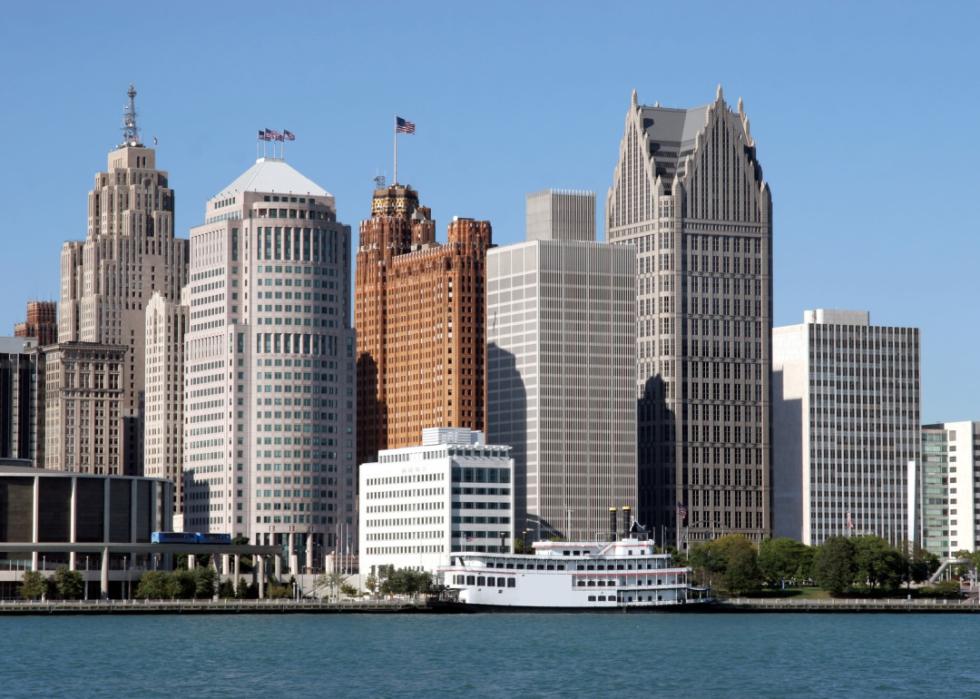
- Annual inflation, H1 2023: 6.4%
--- 1.5 percentage points above the national city average
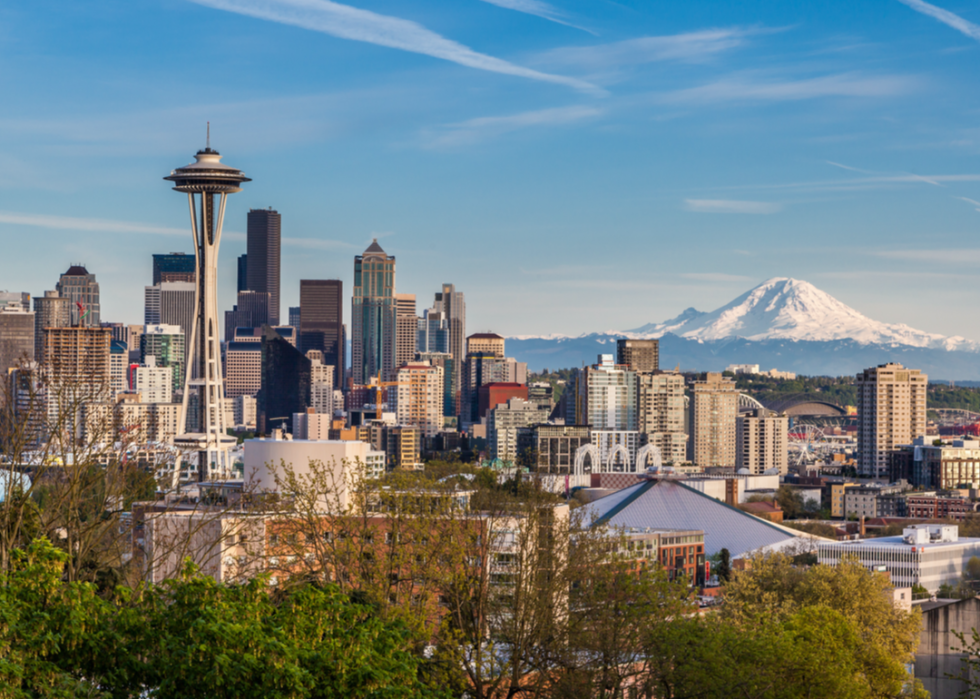
- Annual inflation, H1 2023: 6.8%
--- 1.9 percentage points above the national city average
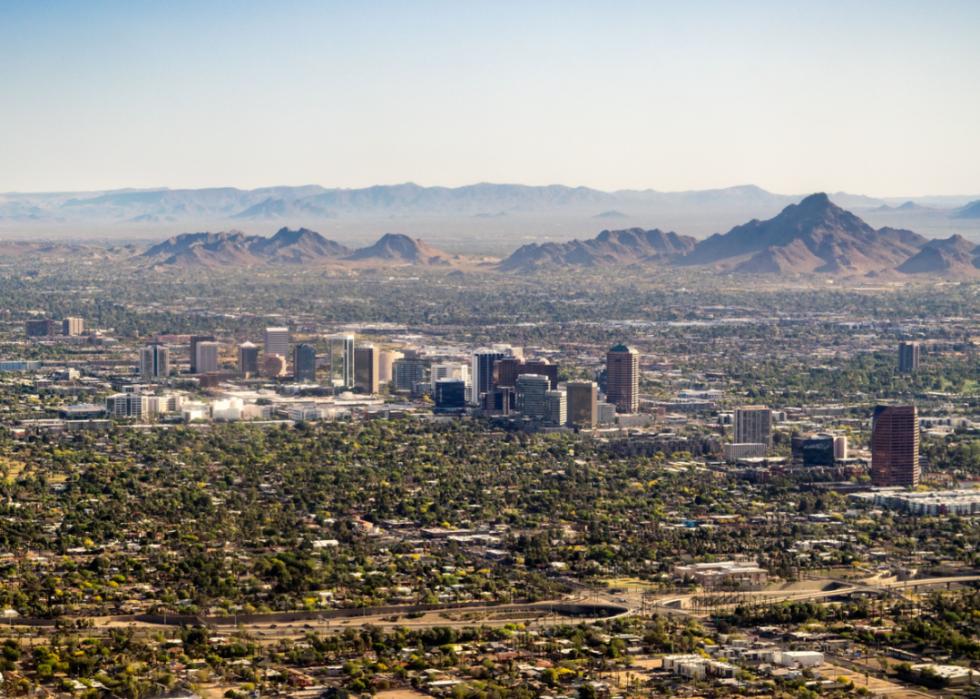
- Annual inflation, H1 2023: 7.3%
--- 2.4 percentage points above the national city average
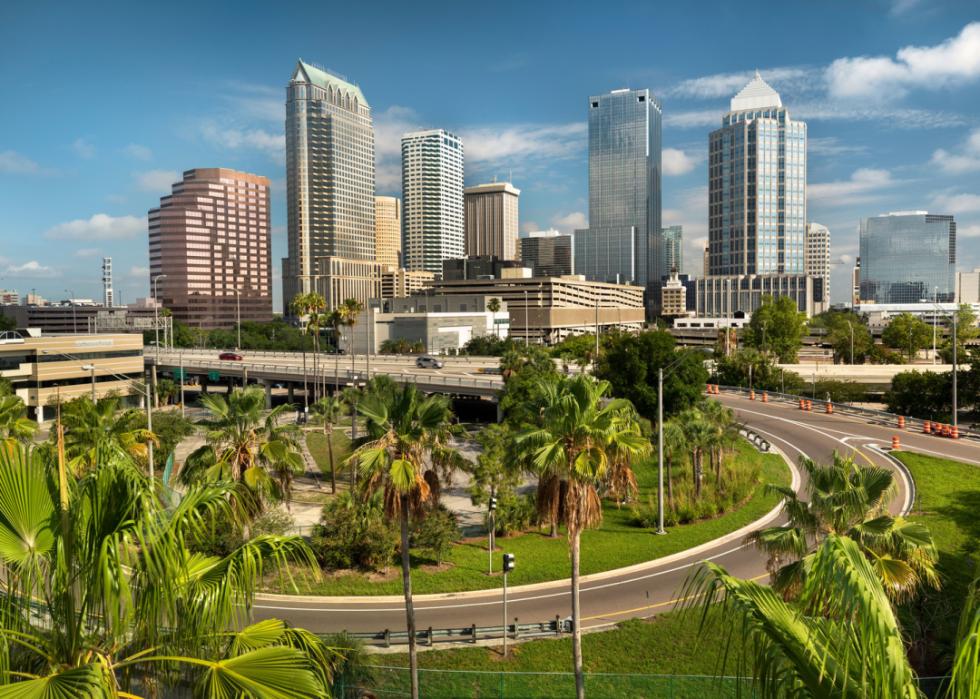
- Annual inflation, H1 2023: 7.7%
--- 2.8 percentage points above the national city average
- Annual inflation, H1 2023: 8.5%
--- 3.6 percentage points above the national city average
Data reporting by Paxtyn Merten. Story editing by Jeff Inglis. Copy editing by Paris Close.
