Where are America's safest suburbs?
SmartAsset
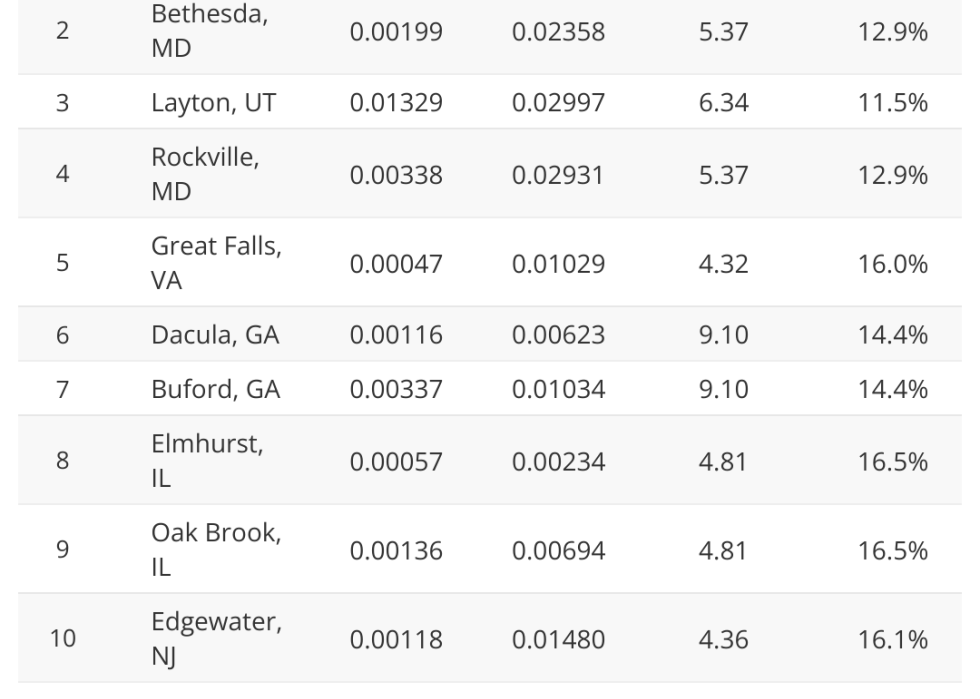
Suburbs are ranked by five safety metrics including crime rates, drug and drinking activity and car accident deaths.
- Lehi, UT
- Violent crime per capita: 0.00083
- Property crime per capita: 0.00715
- Motor vehicle crash deaths per 100,000 residents: 5.75
- Drug overdose deaths per 100,000 residents: 13.03
- Percent of adults participating in excessive drinking: 9.04
- Median monthly housing cost: $1,804
- Median household income: $117,243
- Percent of annual income going to housing: 18.5%
- Bethesda, MD
- Violent crime per capita: 0.00199
- Property crime per capita: 0.02358
- Motor vehicle crash deaths per 100,000 residents: 5.37
- Drug overdose deaths per 100,000 residents: 14.28
- Percent of adults participating in excessive drinking: 12.89
- Median monthly housing cost: $2,742
- Median household income: $185,546
- Percent of annual income going to housing: 17.7%
- Layton, UT
- Violent crime per capita: 0.01329
- Property crime per capita: 0.02997
- Motor vehicle crash deaths per 100,000 residents: 6.34
- Drug overdose deaths per 100,000 residents: 15.16
- Percent of adults participating in excessive drinking: 11.49
- Median monthly housing cost: $1,428
- Median household income: $93,453
- Percent of annual income going to housing: 18.3%
- Rockville, MD
- Violent crime per capita: 0.00338
- Property crime per capita: 0.02931
- Motor vehicle crash deaths per 100,000 residents: 5.37
- Drug overdose deaths per 100,000 residents: 14.28
- Percent of adults participating in excessive drinking: 12.89
- Median monthly housing cost: $2,205
- Median household income: $122,470
- Percent of annual income going to housing: 21.6%
- Great Falls, VA
- Violent crime per capita: 0.00047
- Property crime per capita: 0.01029
- Motor vehicle crash deaths per 100,000 residents: 4.32
- Drug overdose deaths per 100,000 residents: 9.98
- Percent of adults participating in excessive drinking: 16.04
- Median monthly housing cost: $3,952
- Median household income: $250,000
- Percent of annual income going to housing: 19.0%
- Dacula, GA
- Violent crime per capita: 0.00116
- Property crime per capita: 0.00623
- Motor vehicle crash deaths per 100,000 residents: 9.10
- Drug overdose deaths per 100,000 residents: 12.94
- Percent of adults participating in excessive drinking: 14.36
- Median monthly housing cost: $1,256
- Median household income: $81,322
- Percent of annual income going to housing: 18.5%
- Buford, GA
- Violent crime per capita: 0.00337
- Property crime per capita: 0.01034
- Motor vehicle crash deaths per 100,000 residents: 9.10
- Drug overdose deaths per 100,000 residents: 12.94
- Percent of adults participating in excessive drinking: 14.36
- Median monthly housing cost: $1,134
- Median household income: $68,165
- Percent of annual income going to housing: 20.0%
- Elmhurst, IL
- Violent crime per capita: 0.00057
- Property crime per capita: 0.00234
- Motor vehicle crash deaths per 100,000 residents: 4.81
- Drug overdose deaths per 100,000 residents: 15.69
- Percent of adults participating in excessive drinking: 16.46
- Median monthly housing cost: $2,205
- Median household income: $143,492
- Percent of annual income going to housing: 18.4%
- Oak Brook, IL
- Violent crime per capita: 0.00136
- Property crime per capita: 0.00694
- Motor vehicle crash deaths per 100,000 residents: 4.81
- Drug overdose deaths per 100,000 residents: 15.69
- Percent of adults participating in excessive drinking: 16.46
- Median monthly housing cost: $2,549
- Median household income: $158,663
- Percent of annual income going to housing: 19.3%
- Edgewater, NJ
- Violent crime per capita: 0.00118
- Property crime per capita: 0.01480
- Motor vehicle crash deaths per 100,000 residents: 4.36
- Drug overdose deaths per 100,000 residents: 19.00
- Percent of adults participating in excessive drinking: 16.10
- Median monthly housing cost: $2,730
- Median household income: $136,806
- Percent of annual income going to housing: 23.9%
- Palo Alto, CA
- Violent crime per capita: 0.00539
- Property crime per capita: 0.03772
- Motor vehicle crash deaths per 100,000 residents: 6.92
- Drug overdose deaths per 100,000 residents: 14.67
- Percent of adults participating in excessive drinking: 14.92
- Median monthly housing cost: $3,278
- Median household income: $214,118
- Percent of annual income going to housing: 18.4%
- Noblesville, IN
- Violent crime per capita: 0.00075
- Property crime per capita: 0.00683
- Motor vehicle crash deaths per 100,000 residents: 5.18
- Drug overdose deaths per 100,000 residents: 12.71
- Percent of adults participating in excessive drinking: 17.41
- Median monthly housing cost: $1,449
- Median household income: $99,458
- Percent of annual income going to housing: 17.5%
- Naperville, IL
- Violent crime per capita: 0.00794
- Property crime per capita: 0.01643
- Motor vehicle crash deaths per 100,000 residents: 4.81
- Drug overdose deaths per 100,000 residents: 15.69
- Percent of adults participating in excessive drinking: 16.46
- Median monthly housing cost: $2,102
- Median household income: $143,754
- Percent of annual income going to housing: 17.5%
- Mountain View, CA
- Violent crime per capita: 0.00810
- Property crime per capita: 0.03771
- Motor vehicle crash deaths per 100,000 residents: 6.92
- Drug overdose deaths per 100,000 residents: 14.67
- Percent of adults participating in excessive drinking: 14.92
- Median monthly housing cost: $2,948
- Median household income: $174,156
- Percent of annual income going to housing: 20.3%
- Pacifica, CA
- Violent crime per capita: 0.00234
- Property crime per capita: 0.01419
- Motor vehicle crash deaths per 100,000 residents: 5.38
- Drug overdose deaths per 100,000 residents: 15.87
- Percent of adults participating in excessive drinking: 16.65
- Median monthly housing cost: $2,894
- Median household income: $151,849
- Percent of annual income going to housing: 22.9%
- Fishers, IN
- Violent crime per capita: 0.00344
- Property crime per capita: 0.01414
- Motor vehicle crash deaths per 100,000 residents: 5.18
- Drug overdose deaths per 100,000 residents: 12.71
- Percent of adults participating in excessive drinking: 17.41
- Median monthly housing cost: $1,645
- Median household income: $126,548
- Percent of annual income going to housing: 15.6%
- Fort Lee, NJ
- Violent crime per capita: 0.00829
- Property crime per capita: 0.02450
- Motor vehicle crash deaths per 100,000 residents: 4.36
- Drug overdose deaths per 100,000 residents: 19.00
- Percent of adults participating in excessive drinking: 16.10
- Median monthly housing cost: $1,939
- Median household income: $101,573
- Percent of annual income going to housing: 22.9%
- Carmel, IN
- Violent crime per capita: 0.00382
- Property crime per capita: 0.01497
- Motor vehicle crash deaths per 100,000 residents: 5.18
- Drug overdose deaths per 100,000 residents: 12.71
- Percent of adults participating in excessive drinking: 17.41
- Median monthly housing cost: $1,666
- Median household income: $132,859
- Percent of annual income going to housing: 15.0%
- Livermore, CA
- Violent crime per capita: 0.00232
- Property crime per capita: 0.01937
- Motor vehicle crash deaths per 100,000 residents: 6.52
- Drug overdose deaths per 100,000 residents: 18.10
- Percent of adults participating in excessive drinking: 15.85
- Median monthly housing cost: $2,856
- Median household income: $152,590
- Percent of annual income going to housing: 22.5%
- Massapequa, NY
- Violent crime per capita: 0.00137
- Property crime per capita: 0.01007
- Motor vehicle crash deaths per 100,000 residents: 6.07
- Drug overdose deaths per 100,000 residents: 18.39
- Percent of adults participating in excessive drinking: 16.40
- Median monthly housing cost: $3,051
- Median household income: $170,151
- Percent of annual income going to housing: 21.5%
Data and Methodology
To find the safest suburbs, SmartAsset compared data for 360 places that are within 15 to 45 minutes of the 100 largest U.S. cities by car, that have at least 5,000 residents, by the following metrics:
- Violent crime rate. The number of violent crimes per 100,000 residents. Data comes from the FBI's 2022 Uniform Crime Reporting Database; missing crime data was supplemented by NeighborhoodScout.com
- Property crime rate. The number of property crimes per 100,000 residents. Data comes from the FBI's 2022 Uniform Crime Reporting Database; missing crime data was supplemented by NeighborhoodScout.com
- Vehicular mortality rate. The number of deaths due to traffic accidents per 100,000 residents. Data is from the 2024 County Health Rankings.
- Drug poisoning mortality rate. The number of drug poisoning deaths per 100,000 residents. Data is from the 2024 County Health Rankings.
- Percentage of the population engaging in excessive drinking. The percentage of adults who consumed more than four drinks of alcohol for women or five drinks of alcohol for men on a single occasion over a 30-day period, or who engage in heavy drinking, which is defined as drinking more than one drink per day for women or two drinks a day for men on average. Data is from the 2022 County Health Rankings.
The vehicular mortality rate, drug poisoning mortality rate and percentage of the population engaging in excessive drinking are all measured at the county level. Violent and property crime rates are at the city level.
To measure the housing affordability of the 35 safest suburbs, we compared them across the following metrics:
- Median monthly housing costs. Data comes from the Census Bureau's 5-year American Community Survey from 2022.
- Median household income. Data comes from the Census Bureau's 5-year American Community Survey from 2022.
Top 20 Safest Suburbs
No Automated Backlink
Off
seaseasyd // Shutterstock