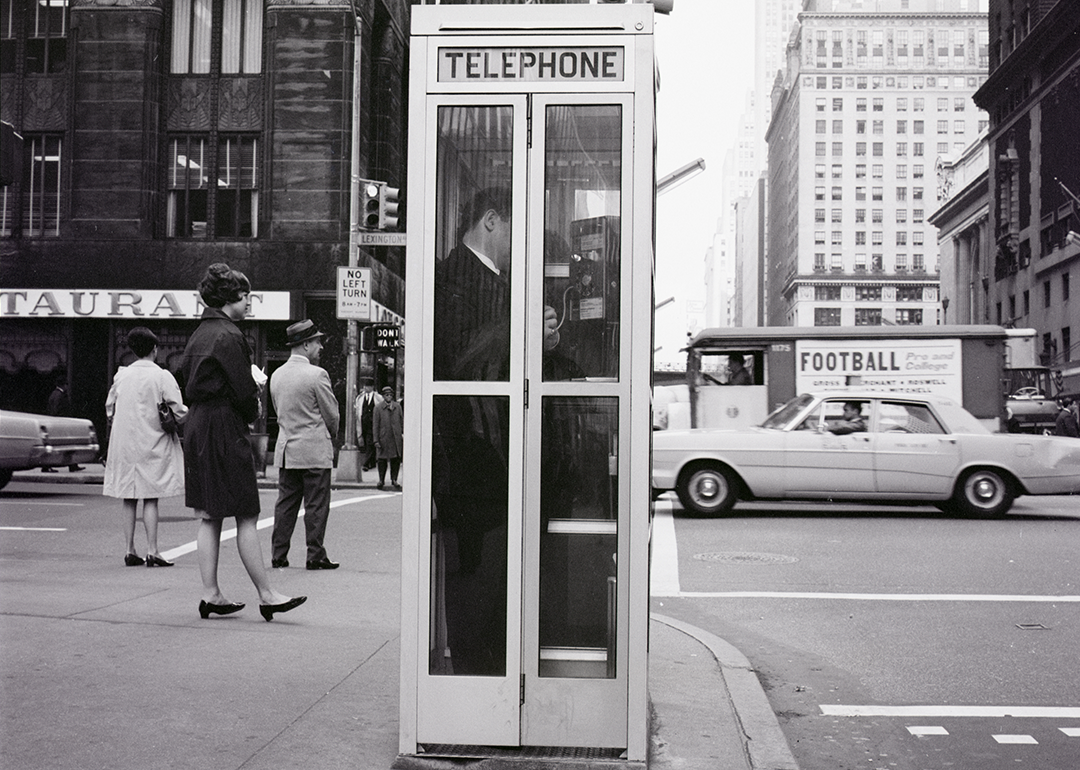
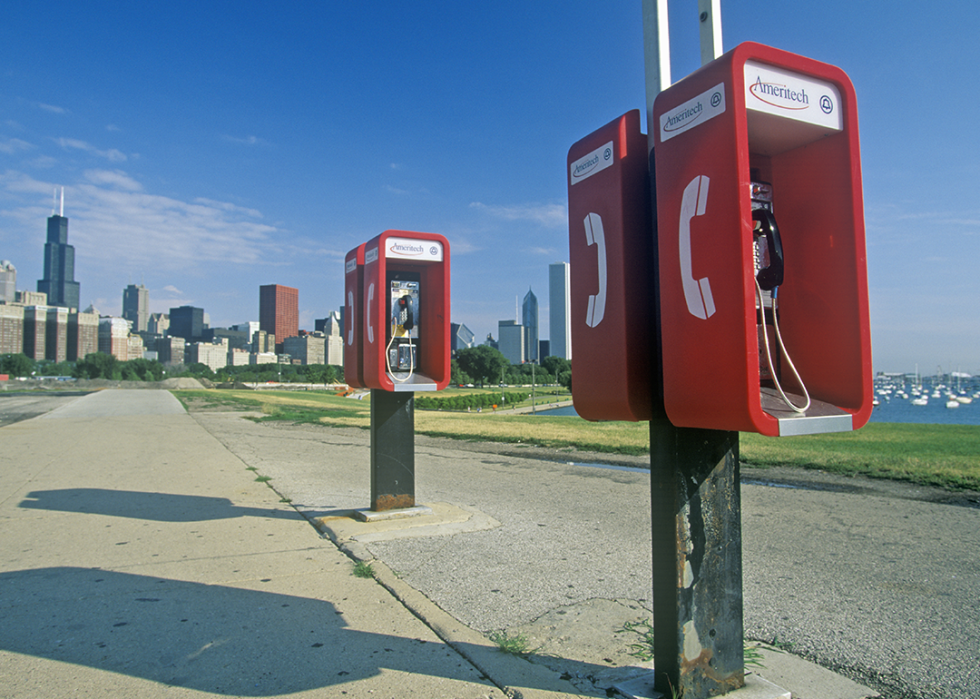
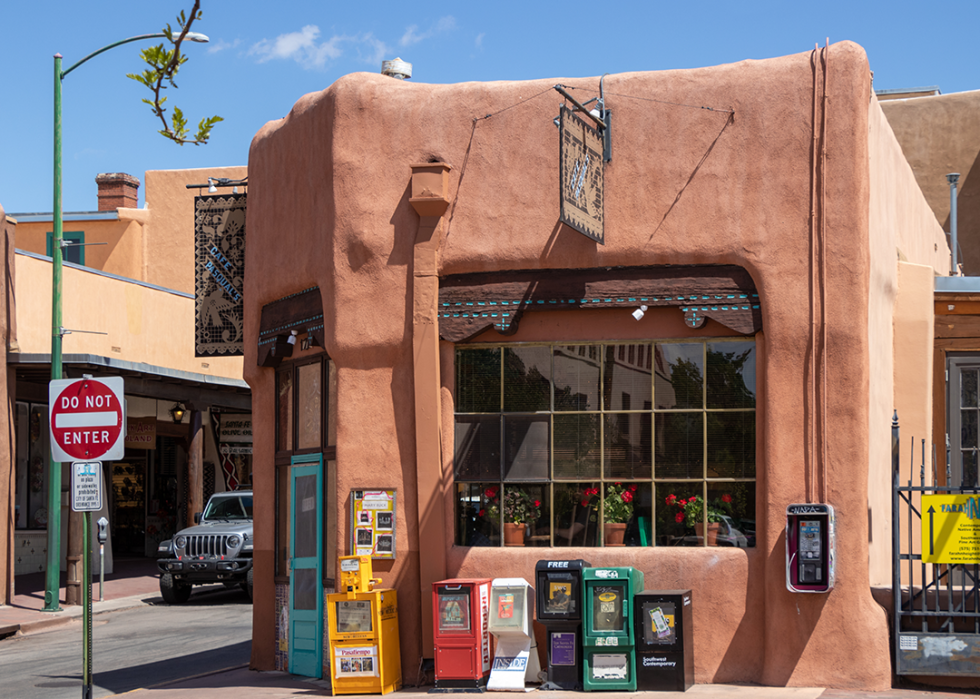
The decline of pay phones in every state
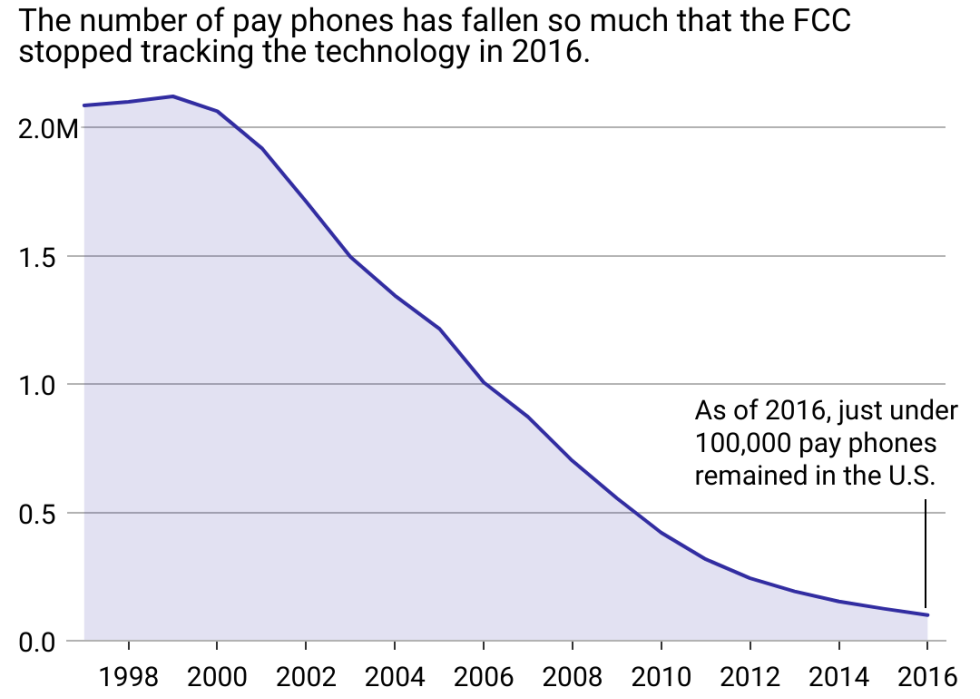
As of 2016, under 100,000 pay phones remained in the U.S., a 95% decline from 2000, when there were over 2 million. This number has likely shrunk significantly since the FCC last collected the data.
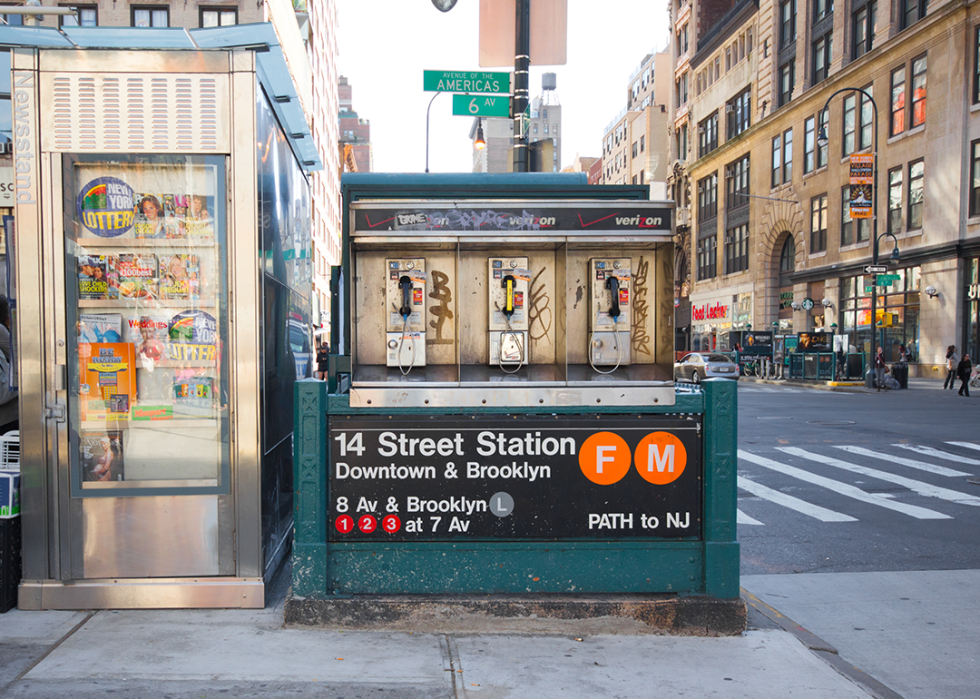
In 2016, New York state accounted for 1 in 5 of the country's remaining pay phones, but many have since been converted for new purposes. New York City removed its last public pay phone in 2016. While some privately operated phones remain, many of the city's phone booths have since been transformed into Wi-Fi corners, embracing a smartphone-centered era of technology.
Read on to find out how pay phones have declined in every state and Washington D.C. during the 2000s and 2010s.
- 59.6% decline in number of pay phones
- Number of pay phones remaining in 2016: 3,615 (253.2 phones per 100K people)
--- Down from 8,943 in 2000 (736.9 phones per 100K people)

- 85.7% decline in number of pay phones
- Number of pay phones remaining in 2016: 1,678 (91.6 phones per 100K people)
--- Down from 11,704 in 2000 (647.7 phones per 100K people)
- 87.9% decline in number of pay phones
- Number of pay phones remaining in 2016: 20,716 (105.5 phones per 100K people)
--- Down from 171,098 in 2000 (900.4 phones per 100K people)

- 88.1% decline in number of pay phones
- Number of pay phones remaining in 2016: 1,150 (60.3 phones per 100K people)
--- Down from 9,668 in 2000 (564.1 phones per 100K people)

- 90.4% decline in number of pay phones
- Number of pay phones remaining in 2016: 440 (59.3 phones per 100K people)
--- Down from 4,583 in 2000 (729.8 phones per 100K people)

- 92.9% decline in number of pay phones
- Number of pay phones remaining in 2016: 1,235 (42.3 phones per 100K people)
--- Down from 17,504 in 2000 (867.1 phones per 100K people)

- 93.1% decline in number of pay phones
- Number of pay phones remaining in 2016: 6,224 (48.7 phones per 100K people)
--- Down from 90,603 in 2000 (737.6 phones per 100K people)

- 93.6% decline in number of pay phones
- Number of pay phones remaining in 2016: 1,073 (19.4 phones per 100K people)
--- Down from 16,831 in 2000 (341.1 phones per 100K people)

- 93.7% decline in number of pay phones
- Number of pay phones remaining in 2016: 700 (22.4 phones per 100K people)
--- Down from 11,183 in 2000 (381.8 phones per 100K people)
- 93.8% decline in number of pay phones
- Number of pay phones remaining in 2016: 16,683 (42.6 phones per 100K people)
--- Down from 267,956 in 2000 (788.4 phones per 100K people)
- 93.9% decline in number of pay phones
- Number of pay phones remaining in 2016: 418 (24.8 phones per 100K people)
--- Down from 6,854 in 2000 (527.5 phones per 100K people)

- 94.6% decline in number of pay phones
- Number of pay phones remaining in 2016: 204 (32.7 phones per 100K people)
--- Down from 3,761 in 2000 (616.9 phones per 100K people)

- 94.8% decline in number of pay phones
- Number of pay phones remaining in 2016: 201 (34.4 phones per 100K people)
--- Down from 3,868 in 2000 (782.5 phones per 100K people)
- 94.9% decline in number of pay phones
- Number of pay phones remaining in 2016: 1,695 (24.4 phones per 100K people)
--- Down from 33,363 in 2000 (646.5 phones per 100K people)

- 95% decline in number of pay phones
- Number of pay phones remaining in 2016: 1,730 (23.7 phones per 100K people)
--- Down from 34,368 in 2000 (581.5 phones per 100K people)

- 95% decline in number of pay phones
- Number of pay phones remaining in 2016: 1,076 (26.3 phones per 100K people)
--- Down from 21,659 in 2000 (631.5 phones per 100K people)

- 95.3% decline in number of pay phones
- Number of pay phones remaining in 2016: 7,006 (25.1 phones per 100K people)
--- Down from 147,720 in 2000 (705.3 phones per 100K people)

- 95.3% decline in number of pay phones
- Number of pay phones remaining in 2016: 542 (17.8 phones per 100K people)
--- Down from 11,466 in 2000 (510.8 phones per 100K people)

- 95.4% decline in number of pay phones
- Number of pay phones remaining in 2016: 1,246 (22.5 phones per 100K people)
--- Down from 27,035 in 2000 (624.8 phones per 100K people)

- 95.4% decline in number of pay phones
- Number of pay phones remaining in 2016: 880 (19.8 phones per 100K people)
--- Down from 19,233 in 2000 (475 phones per 100K people)

- 95.5% decline in number of pay phones
- Number of pay phones remaining in 2016: 113 (15 phones per 100K people)
--- Down from 2,507 in 2000 (390.5 phones per 100K people)

- 95.5% decline in number of pay phones
- Number of pay phones remaining in 2016: 364 (27.1 phones per 100K people)
--- Down from 8,132 in 2000 (655.9 phones per 100K people)

- 95.7% decline in number of pay phones
- Number of pay phones remaining in 2016: 2,268 (33.2 phones per 100K people)
--- Down from 53,034 in 2000 (833.7 phones per 100K people)

- 95.8% decline in number of pay phones
- Number of pay phones remaining in 2016: 317 (23.8 phones per 100K people)
--- Down from 7,496 in 2000 (587 phones per 100K people)

- 95.8% decline in number of pay phones
- Number of pay phones remaining in 2016: 245 (23.5 phones per 100K people)
--- Down from 5,884 in 2000 (651 phones per 100K people)

- 96.3% decline in number of pay phones
- Number of pay phones remaining in 2016: 3,517 (39.6 phones per 100K people)
--- Down from 95,781 in 2000 (1136.1 phones per 100K people)
- 96.4% decline in number of pay phones
- Number of pay phones remaining in 2016: 2,540 (21.8 phones per 100K people)
--- Down from 71,266 in 2000 (627.1 phones per 100K people)
- 96.8% decline in number of pay phones
- Number of pay phones remaining in 2016: 3,423 (26.7 phones per 100K people)
--- Down from 106,368 in 2000 (855.4 phones per 100K people)
- 96.9% decline in number of pay phones
- Number of pay phones remaining in 2016: 530 (17.7 phones per 100K people)
--- Down from 16,954 in 2000 (632.9 phones per 100K people)

- 96.9% decline in number of pay phones
- Number of pay phones remaining in 2016: 1,104 (19.1 phones per 100K people)
--- Down from 35,383 in 2000 (658.4 phones per 100K people)

- 96.9% decline in number of pay phones
- Number of pay phones remaining in 2016: 175 (18.4 phones per 100K people)
--- Down from 5,694 in 2000 (724.1 phones per 100K people)

- 97% decline in number of pay phones
- Number of pay phones remaining in 2016: 1,401 (13.8 phones per 100K people)
--- Down from 45,943 in 2000 (568.5 phones per 100K people)

- 97% decline in number of pay phones
- Number of pay phones remaining in 2016: 1,286 (19.4 phones per 100K people)
--- Down from 42,429 in 2000 (696.5 phones per 100K people)
- 97% decline in number of pay phones
- Number of pay phones remaining in 2016: 3,605 (17.5 phones per 100K people)
--- Down from 119,207 in 2000 (742.8 phones per 100K people)
- 97.2% decline in number of pay phones
- Number of pay phones remaining in 2016: 119 (13.8 phones per 100K people)
--- Down from 4,326 in 2000 (572.3 phones per 100K people)
- 97.3% decline in number of pay phones
- Number of pay phones remaining in 2016: 306 (14.6 phones per 100K people)
--- Down from 11,374 in 2000 (624.5 phones per 100K people)

- 97.4% decline in number of pay phones
- Number of pay phones remaining in 2016: 446 (15.3 phones per 100K people)
--- Down from 16,949 in 2000 (629.2 phones per 100K people)

- 97.4% decline in number of pay phones
- Number of pay phones remaining in 2016: 235 (22.2 phones per 100K people)
--- Down from 8,935 in 2000 (850.7 phones per 100K people)

- 97.5% decline in number of pay phones
- Number of pay phones remaining in 2016: 1,074 (17.9 phones per 100K people)
--- Down from 43,336 in 2000 (816 phones per 100K people)

- 97.6% decline in number of pay phones
- Number of pay phones remaining in 2016: 257 (37.5 phones per 100K people)
--- Down from 10,505 in 2000 (1836.4 phones per 100K people)

- 97.6% decline in number of pay phones
- Number of pay phones remaining in 2016: 1,405 (16.7 phones per 100K people)
--- Down from 57,621 in 2000 (810.9 phones per 100K people)
- 97.7% decline in number of pay phones
- Number of pay phones remaining in 2016: 546 (11.2 phones per 100K people)
--- Down from 24,237 in 2000 (544.4 phones per 100K people)
- 97.9% decline in number of pay phones
- Number of pay phones remaining in 2016: 611 (12.3 phones per 100K people)
--- Down from 28,444 in 2000 (706.8 phones per 100K people)

- 98% decline in number of pay phones
- Number of pay phones remaining in 2016: 861 (14.1 phones per 100K people)
--- Down from 42,510 in 2000 (758.1 phones per 100K people)

- 98% decline in number of pay phones
- Number of pay phones remaining in 2016: 515 (14.4 phones per 100K people)
--- Down from 25,941 in 2000 (760.3 phones per 100K people)
- 98% decline in number of pay phones
- Number of pay phones remaining in 2016: 511 (13 phones per 100K people)
--- Down from 26,164 in 2000 (757.4 phones per 100K people)

- 98.1% decline in number of pay phones
- Number of pay phones remaining in 2016: 539 (11.5 phones per 100K people)
--- Down from 27,835 in 2000 (622.4 phones per 100K people)

- 98.4% decline in number of pay phones
- Number of pay phones remaining in 2016: 637 (9.6 phones per 100K people)
--- Down from 38,929 in 2000 (682.5 phones per 100K people)
- 98.4% decline in number of pay phones
- Number of pay phones remaining in 2016: 995 (9.7 phones per 100K people)
--- Down from 61,519 in 2000 (747.7 phones per 100K people)

- 98.6% decline in number of pay phones
- Number of pay phones remaining in 2016: 1,187 (11.9 phones per 100K people)
--- Down from 83,159 in 2000 (835.6 phones per 100K people)

- 98.8% decline in number of pay phones
- Number of pay phones remaining in 2016: 188 (6.3 phones per 100K people)
--- Down from 16,201 in 2000 (568.8 phones per 100K people)
Story editing by Alizah Salario. Copy editing by Kristen Wegrzyn.