Counties with the highest rates of strokes in South Dakota
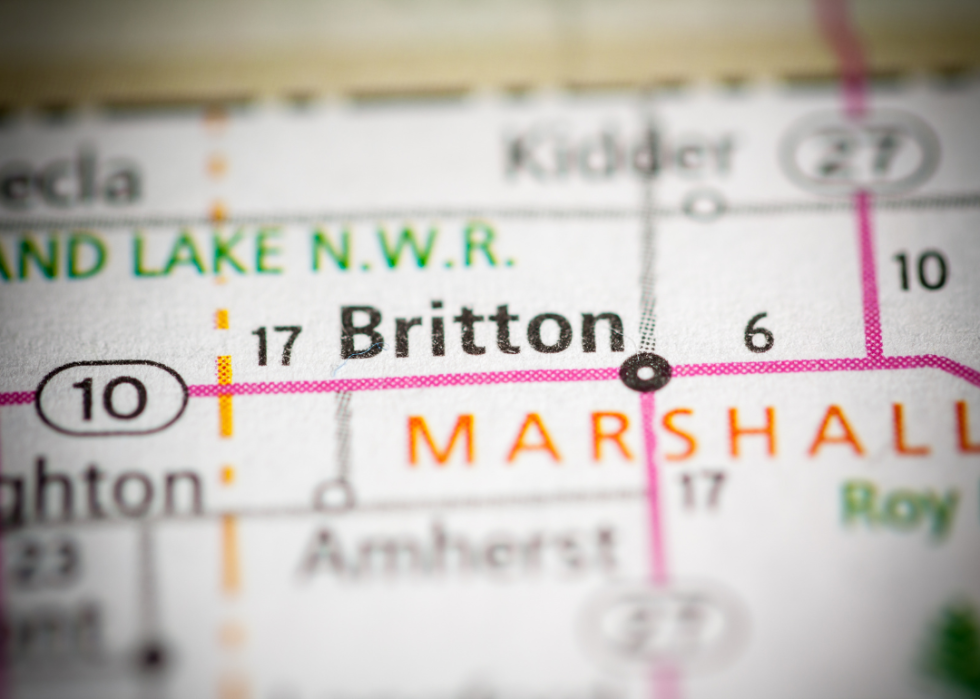
- Death rate for ischemic strokes, 2018-20: 17.6 per 100K people
- Death rate for hemorrhagic strokes, 2018-20: 7.6 per 100K people

- Death rate for ischemic strokes, 2018-20: 17.7 per 100K people
- Death rate for hemorrhagic strokes, 2018-20: 8.9 per 100K people

- Death rate for ischemic strokes, 2018-20: 18.3 per 100K people
- Death rate for hemorrhagic strokes, 2018-20: 7.3 per 100K people
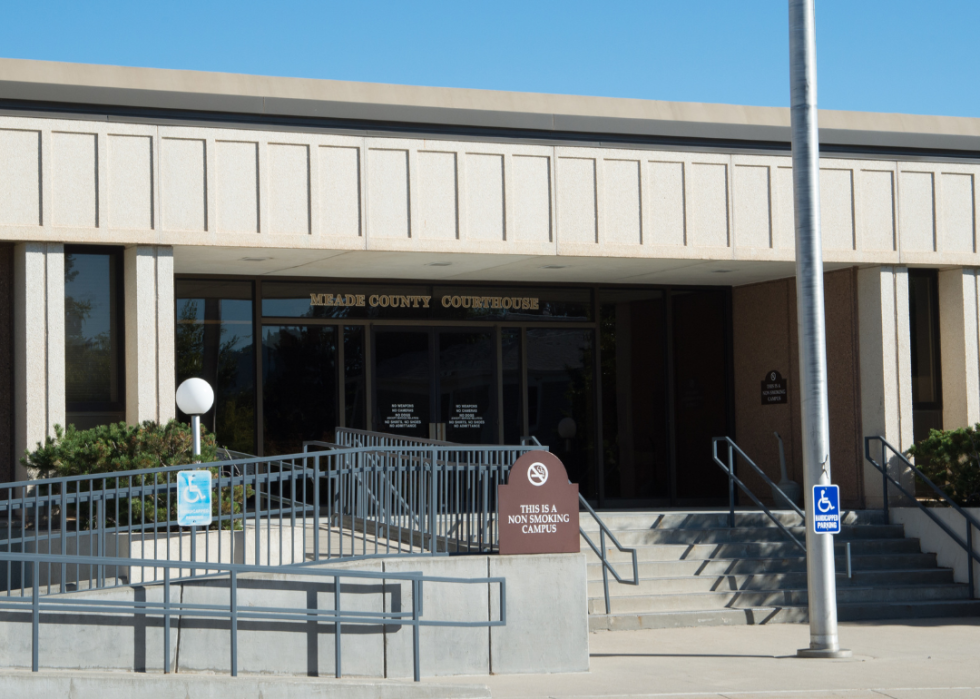
- Death rate for ischemic strokes, 2018-20: 18.5 per 100K people
- Death rate for hemorrhagic strokes, 2018-20: 8.4 per 100K people

- Death rate for ischemic strokes, 2018-20: 19.7 per 100K people
- Death rate for hemorrhagic strokes, 2018-20: 8.7 per 100K people
You may also like: Counties in South Dakota where people spend most of their paycheck on housing

- Death rate for ischemic strokes, 2018-20: 20.0 per 100K people
- Death rate for hemorrhagic strokes, 2018-20: 7.1 per 100K people
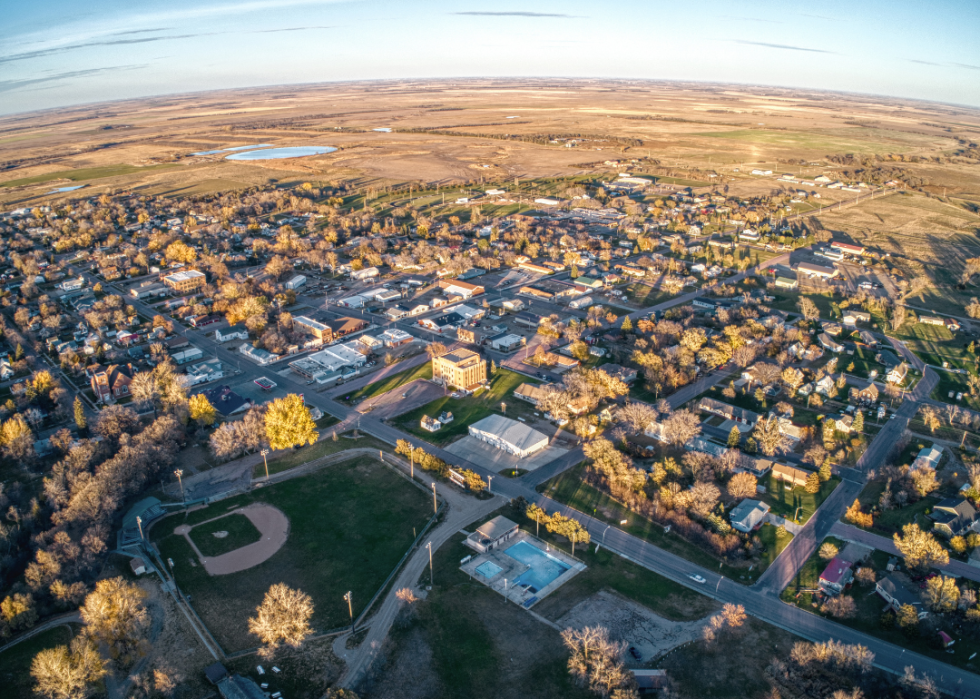
- Death rate for ischemic strokes, 2018-20: 20.1 per 100K people
- Death rate for hemorrhagic strokes, 2018-20: 5.4 per 100K people
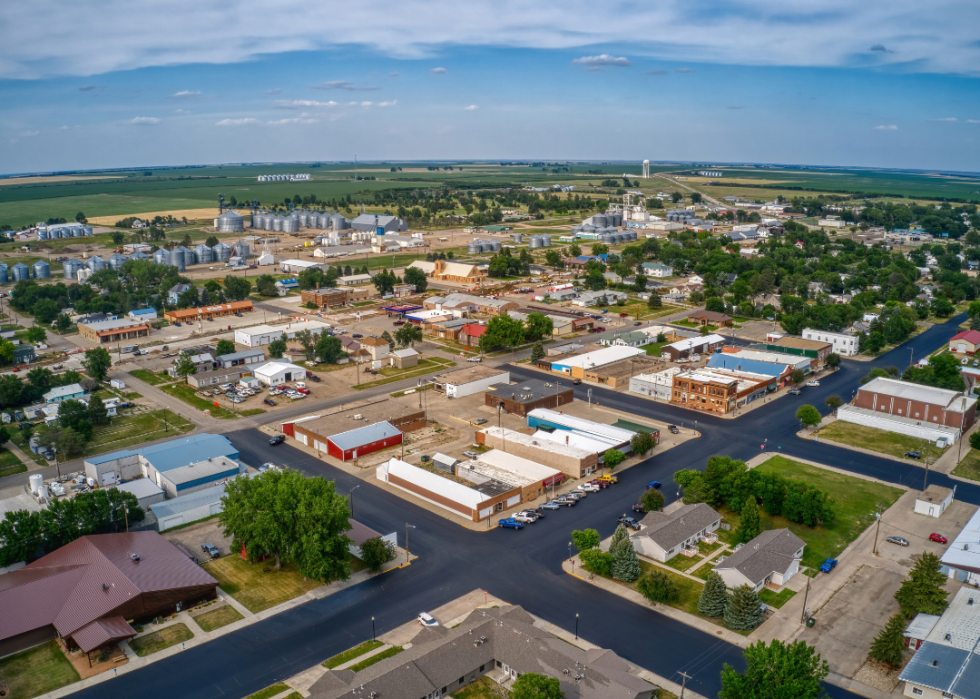
- Death rate for ischemic strokes, 2018-20: 20.3 per 100K people
- Death rate for hemorrhagic strokes, 2018-20: 6.5 per 100K people
- Death rate for ischemic strokes, 2018-20: 20.3 per 100K people
- Death rate for hemorrhagic strokes, 2018-20: 9.4 per 100K people
- Death rate for ischemic strokes, 2018-20: 20.9 per 100K people
- Death rate for hemorrhagic strokes, 2018-20: 8.6 per 100K people
You may also like: Counties with the highest rate of food insecurity in South Dakota
- Death rate for ischemic strokes, 2018-20: 21.8 per 100K people
- Death rate for hemorrhagic strokes, 2018-20: -1.0 per 100K people
- Death rate for ischemic strokes, 2018-20: 22.5 per 100K people
- Death rate for hemorrhagic strokes, 2018-20: 5.8 per 100K people
- Death rate for ischemic strokes, 2018-20: 24.0 per 100K people
- Death rate for hemorrhagic strokes, 2018-20: 4.7 per 100K people

- Death rate for ischemic strokes, 2018-20: 27.3 per 100K people
- Death rate for hemorrhagic strokes, 2018-20: -1.0 per 100K people
- Death rate for ischemic strokes, 2018-20: 27.5 per 100K people
- Death rate for hemorrhagic strokes, 2018-20: 9.7 per 100K people
You may also like: 10.7 percent of households in South Dakota receive food stamps
- Death rate for ischemic strokes, 2018-20: 16.0 per 100K people
- Death rate for hemorrhagic strokes, 2018-20: -1.0 per 100K people

- Death rate for ischemic strokes, 2018-20: 18.5 per 100K people
- Death rate for hemorrhagic strokes, 2018-20: 7.5 per 100K people
- Death rate for ischemic strokes, 2018-20: 19.9 per 100K people
- Death rate for hemorrhagic strokes, 2018-20: 9.5 per 100K people

- Death rate for ischemic strokes, 2018-20: 22.6 per 100K people
- Death rate for hemorrhagic strokes, 2018-20: 6.6 per 100K people
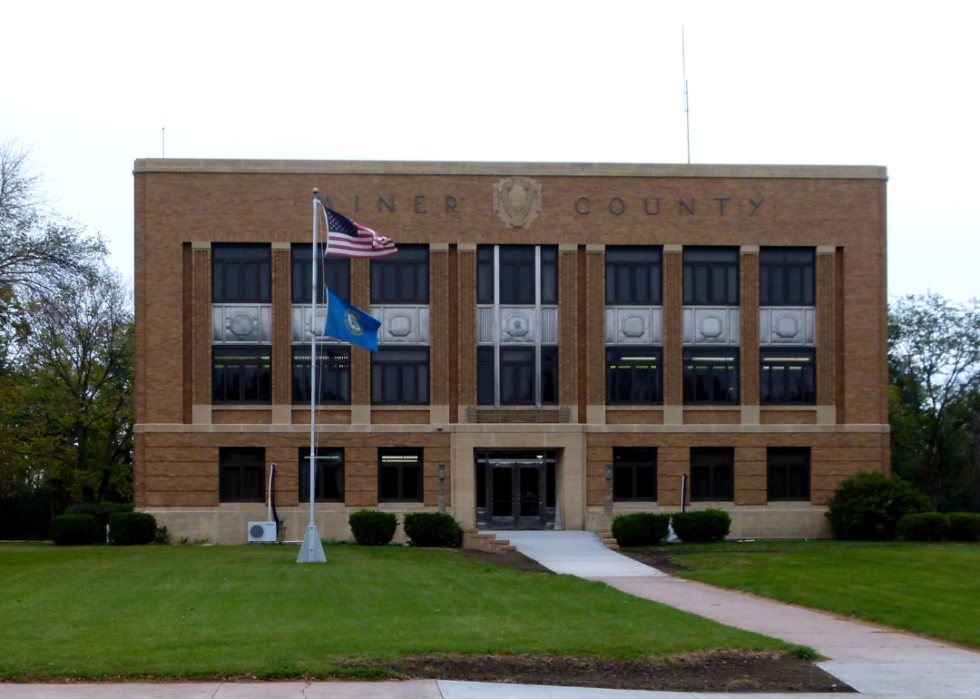
- Death rate for ischemic strokes, 2018-20: 23.8 per 100K people
- Death rate for hemorrhagic strokes, 2018-20: 6.5 per 100K people
You may also like: Zip codes with the most expensive homes in South Dakota

- Death rate for ischemic strokes, 2018-20: 24.3 per 100K people
- Death rate for hemorrhagic strokes, 2018-20: 10.0 per 100K people

- Death rate for ischemic strokes, 2018-20: 24.9 per 100K people
- Death rate for hemorrhagic strokes, 2018-20: 5.2 per 100K people

- Death rate for ischemic strokes, 2018-20: 28.7 per 100K people
- Death rate for hemorrhagic strokes, 2018-20: 5.5 per 100K people
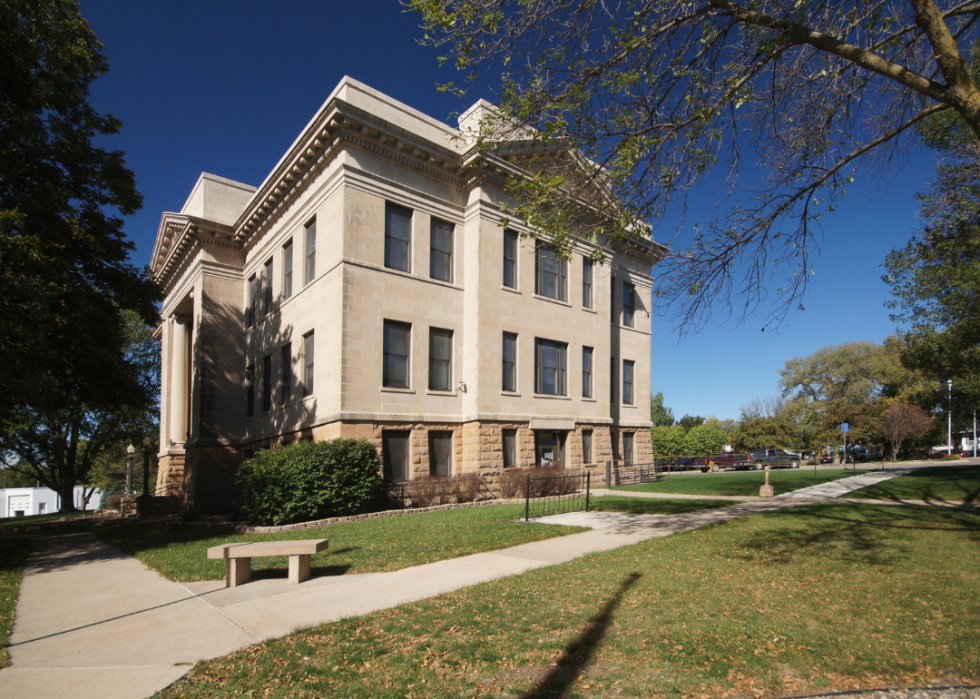
- Death rate for ischemic strokes, 2018-20: 11.3 per 100K people
- Death rate for hemorrhagic strokes, 2018-20: 8.4 per 100K people

- Death rate for ischemic strokes, 2018-20: 18.7 per 100K people
- Death rate for hemorrhagic strokes, 2018-20: 7.2 per 100K people
You may also like: Best community colleges in South Dakota
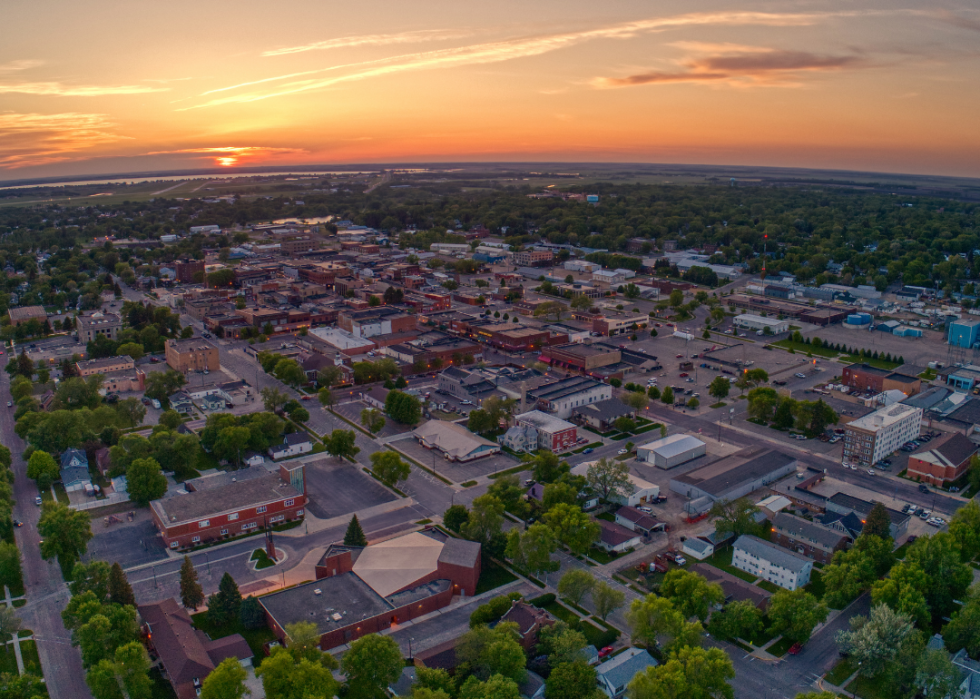
- Death rate for ischemic strokes, 2018-20: 19.2 per 100K people
- Death rate for hemorrhagic strokes, 2018-20: 9.9 per 100K people
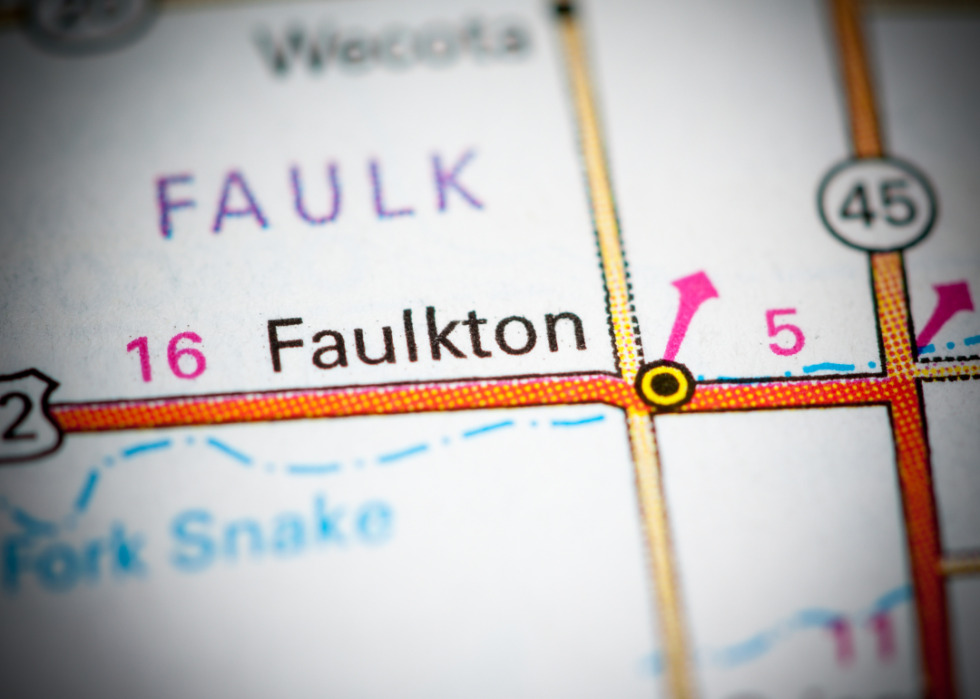
- Death rate for ischemic strokes, 2018-20: 20.8 per 100K people
- Death rate for hemorrhagic strokes, 2018-20: 6.7 per 100K people

- Death rate for ischemic strokes, 2018-20: 29.7 per 100K people
- Death rate for hemorrhagic strokes, 2018-20: 5.1 per 100K people

- Death rate for ischemic strokes, 2018-20: 17.9 per 100K people
- Death rate for hemorrhagic strokes, 2018-20: 10.4 per 100K people

- Death rate for ischemic strokes, 2018-20: 20.4 per 100K people
- Death rate for hemorrhagic strokes, 2018-20: 9.8 per 100K people
You may also like: Famous actors from South Dakota
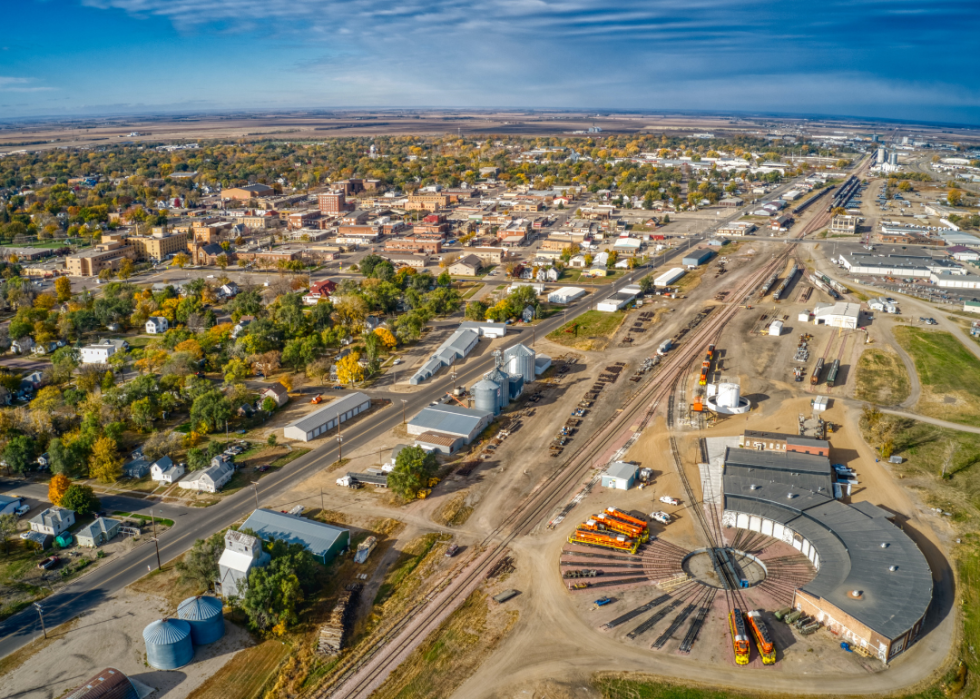
- Death rate for ischemic strokes, 2018-20: 20.6 per 100K people
- Death rate for hemorrhagic strokes, 2018-20: 6.5 per 100K people

- Death rate for ischemic strokes, 2018-20: 15.6 per 100K people
- Death rate for hemorrhagic strokes, 2018-20: 2.3 per 100K people
- Death rate for ischemic strokes, 2018-20: 18.5 per 100K people
- Death rate for hemorrhagic strokes, 2018-20: 8.9 per 100K people
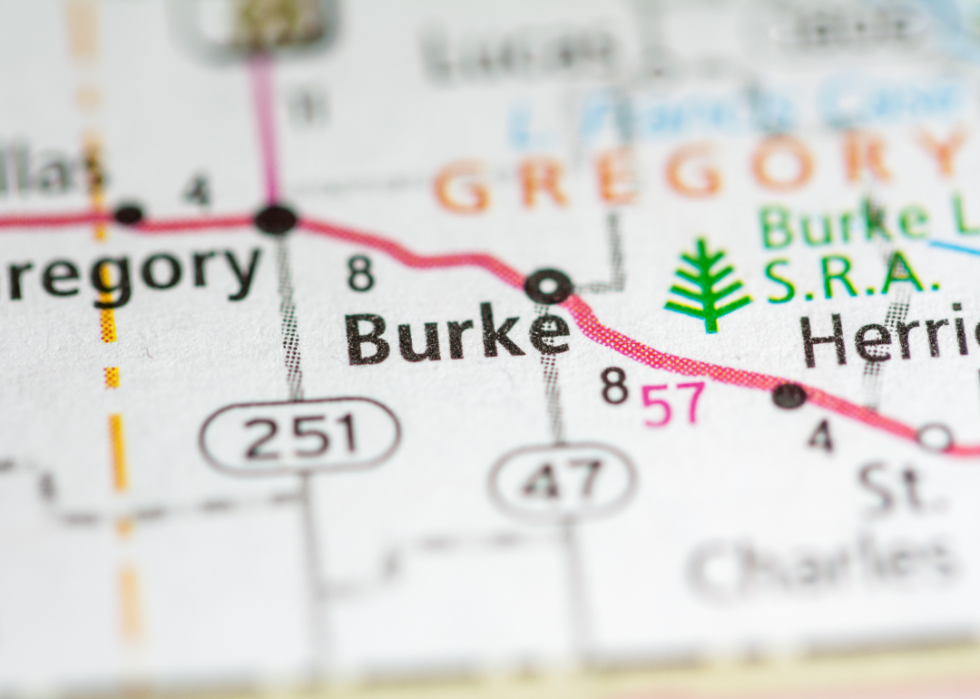
- Death rate for ischemic strokes, 2018-20: 18.6 per 100K people
- Death rate for hemorrhagic strokes, 2018-20: 7.5 per 100K people

- Death rate for ischemic strokes, 2018-20: 18.8 per 100K people
- Death rate for hemorrhagic strokes, 2018-20: 7.7 per 100K people
You may also like: Best private high schools in South Dakota

- Death rate for ischemic strokes, 2018-20: 21.3 per 100K people
- Death rate for hemorrhagic strokes, 2018-20: 3.5 per 100K people
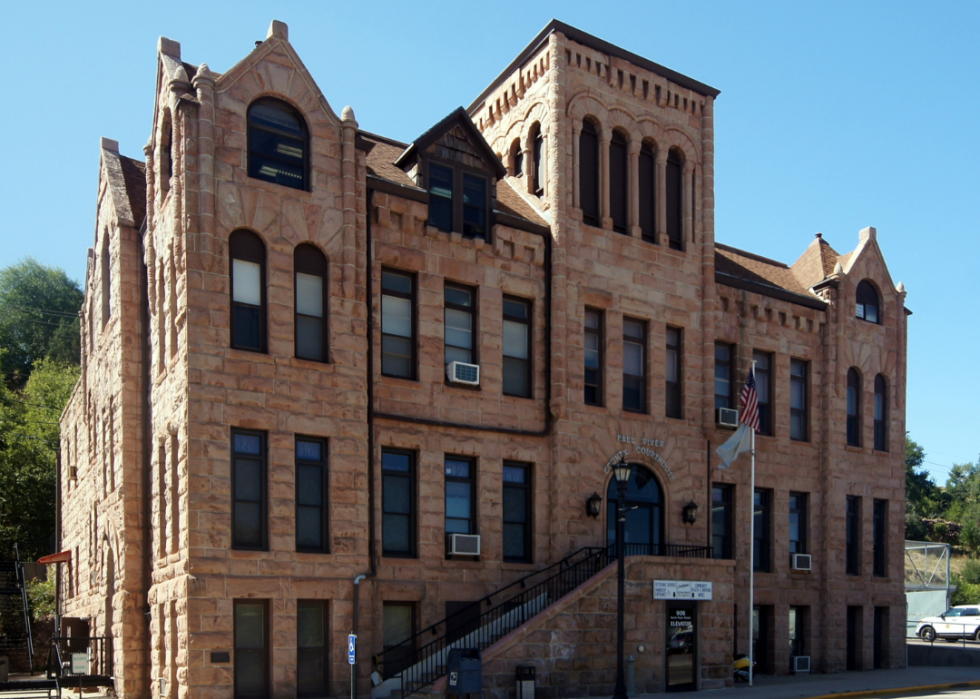
- Death rate for ischemic strokes, 2018-20: 16.8 per 100K people
- Death rate for hemorrhagic strokes, 2018-20: 3.4 per 100K people

- Death rate for ischemic strokes, 2018-20: 14.3 per 100K people
- Death rate for hemorrhagic strokes, 2018-20: 19.2 per 100K people

- Death rate for ischemic strokes, 2018-20: 22.5 per 100K people
- Death rate for hemorrhagic strokes, 2018-20: 1.1 per 100K people

- Death rate for ischemic strokes, 2018-20: 17.6 per 100K people
- Death rate for hemorrhagic strokes, 2018-20: 19.6 per 100K people
You may also like: Counties with the most born-and-bred residents in South Dakota

- Death rate for ischemic strokes, 2018-20: 19.2 per 100K people
- Death rate for hemorrhagic strokes, 2018-20: 8.8 per 100K people
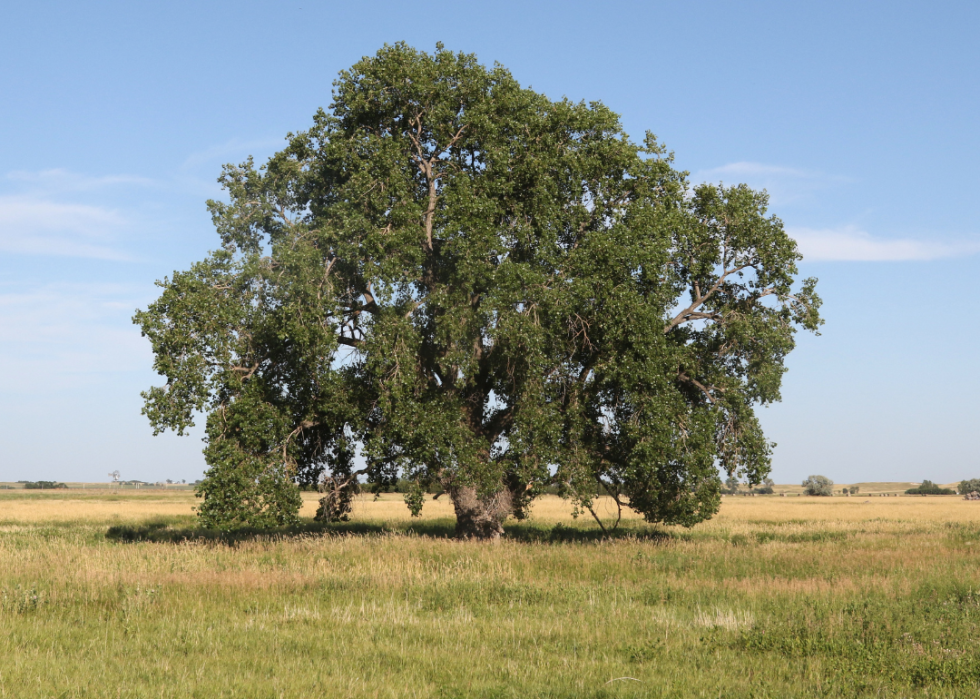
- Death rate for ischemic strokes, 2018-20: 16.5 per 100K people
- Death rate for hemorrhagic strokes, 2018-20: 9.8 per 100K people
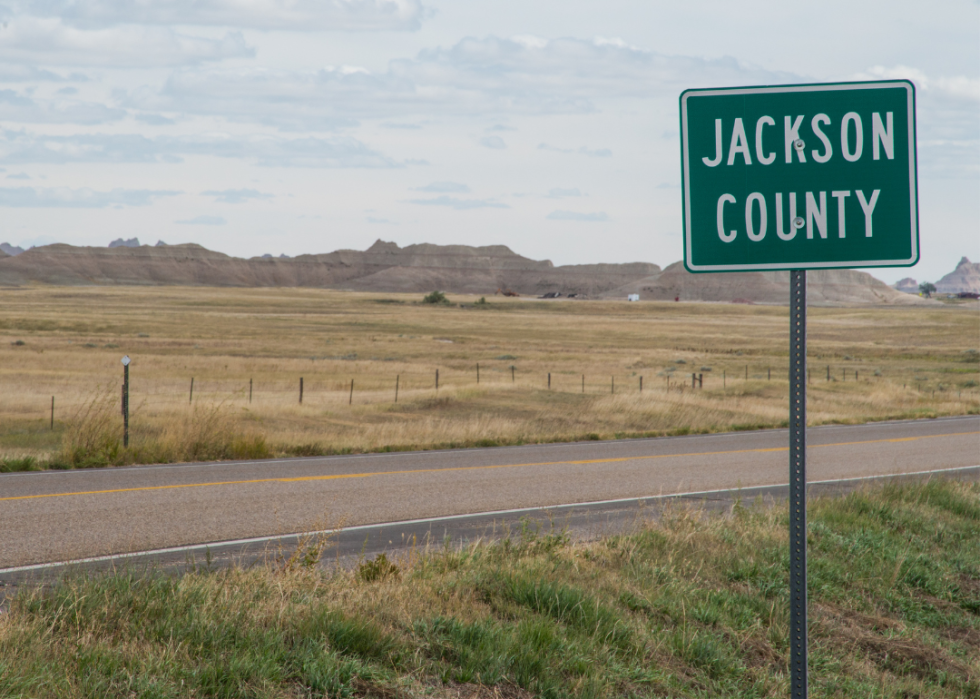
- Death rate for ischemic strokes, 2018-20: 17.5 per 100K people
- Death rate for hemorrhagic strokes, 2018-20: 6.7 per 100K people

- Death rate for ischemic strokes, 2018-20: 17.0 per 100K people
- Death rate for hemorrhagic strokes, 2018-20: 8.4 per 100K people
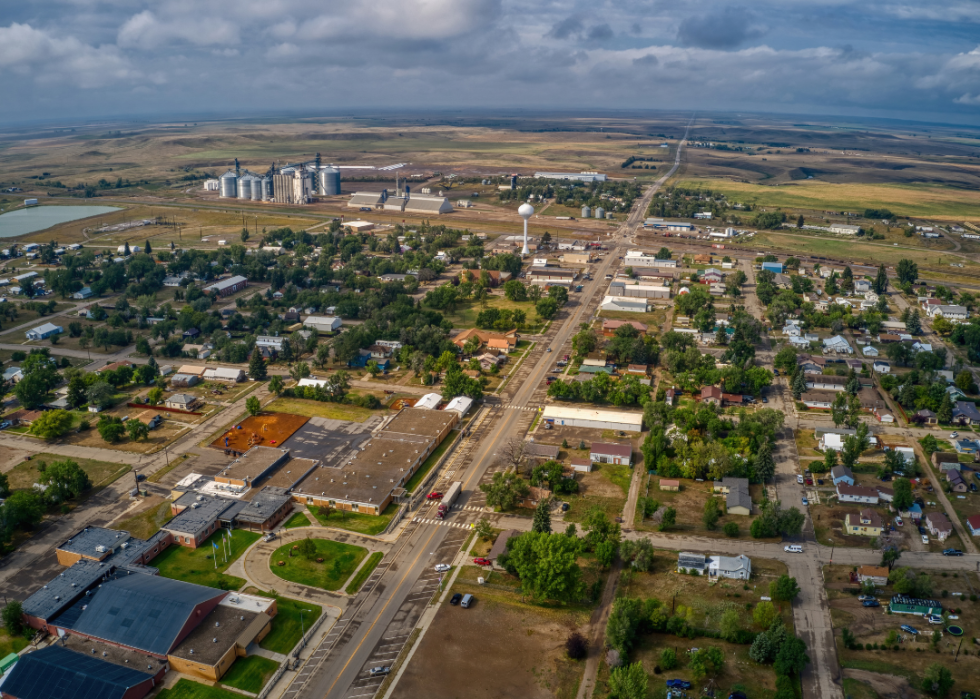
- Death rate for ischemic strokes, 2018-20: 19.3 per 100K people
- Death rate for hemorrhagic strokes, 2018-20: 10.8 per 100K people
You may also like: Best counties to retire to in South Dakota
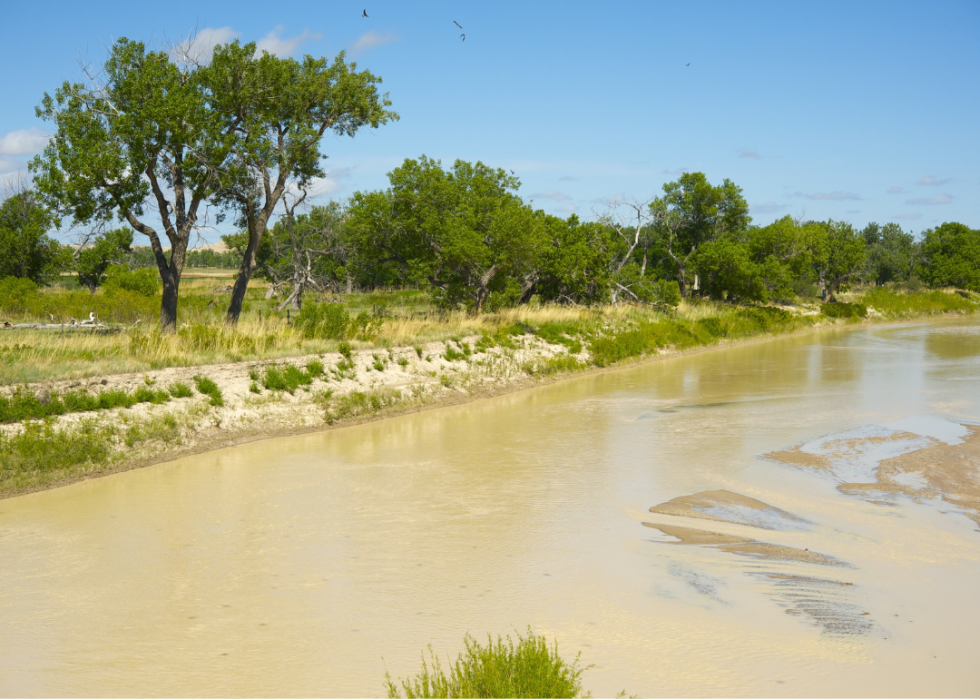
- Death rate for ischemic strokes, 2018-20: 15.9 per 100K people
- Death rate for hemorrhagic strokes, 2018-20: 20.3 per 100K people
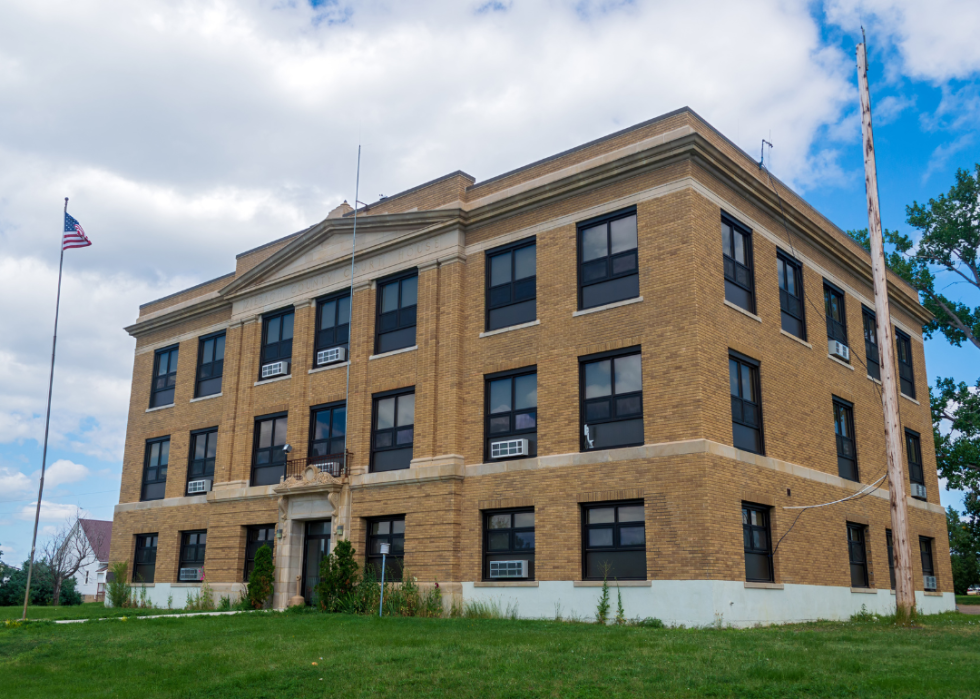
- Death rate for ischemic strokes, 2018-20: 18.6 per 100K people
- Death rate for hemorrhagic strokes, 2018-20: 8.2 per 100K people

- Death rate for ischemic strokes, 2018-20: 17.8 per 100K people
- Death rate for hemorrhagic strokes, 2018-20: 12.6 per 100K people

- Death rate for ischemic strokes, 2018-20: 15.6 per 100K people
- Death rate for hemorrhagic strokes, 2018-20: 7.1 per 100K people

- Death rate for ischemic strokes, 2018-20: 14.8 per 100K people
- Death rate for hemorrhagic strokes, 2018-20: 20.2 per 100K people
You may also like: Highest-rated football recruits from South Dakota over the last 20 years
This story features data reporting and writing by Emma Rubin and is part of a series utilizing data automation across 49 states.
