Counties with the most bridges in dire need of repair in South Dakota
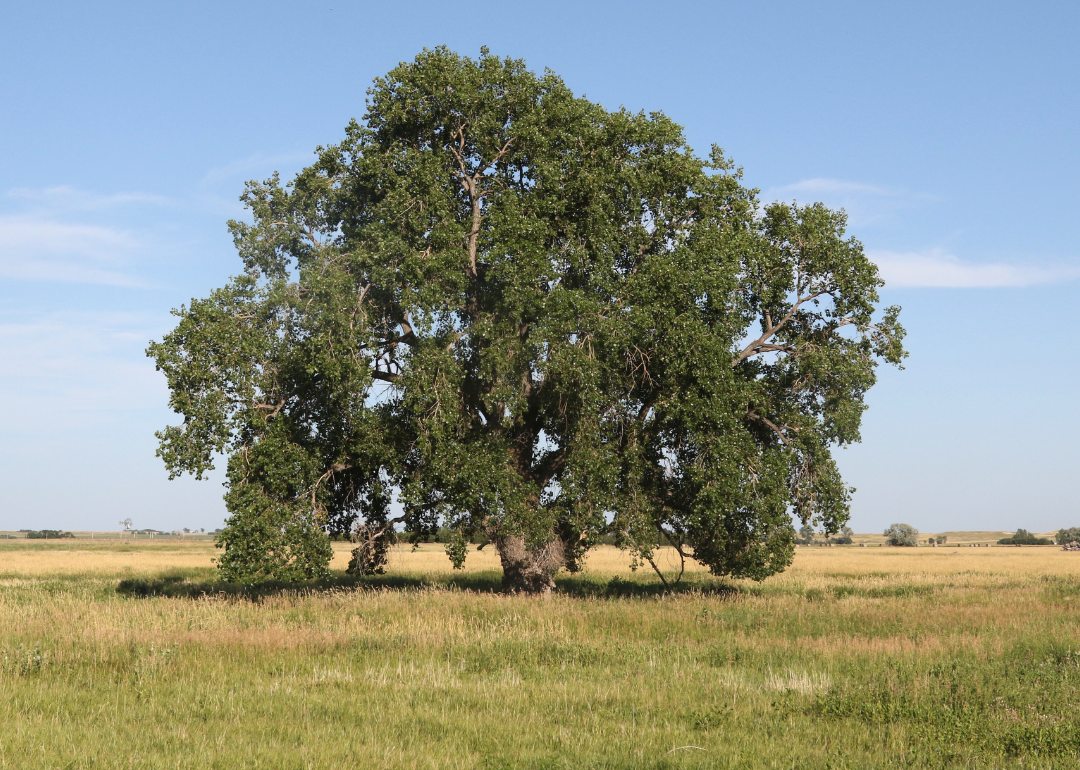
- Bridges in poor condition: 21.4% (3 of 14 bridges)
- Square meters of bridges in poor condition: 7.0% (192 of 2,760 square meters of bridges)
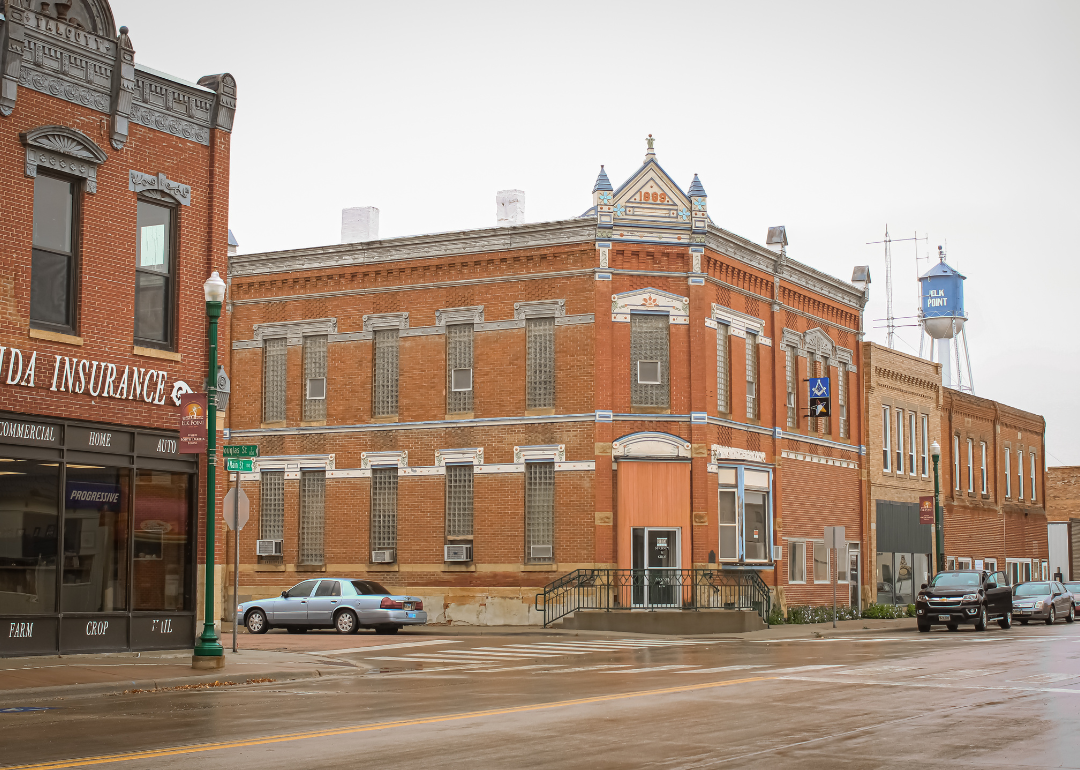
- Bridges in poor condition: 21.6% (37 of 171 bridges)
- Square meters of bridges in poor condition: 9.6% (5,184 of 53,901 square meters of bridges)

- Bridges in poor condition: 22.0% (51 of 232 bridges)
- Square meters of bridges in poor condition: 10.4% (6,663 of 63,831 square meters of bridges)

- Bridges in poor condition: 22.2% (32 of 144 bridges)
- Square meters of bridges in poor condition: 13.1% (4,211 of 32,234 square meters of bridges)

- Bridges in poor condition: 22.3% (23 of 103 bridges)
- Square meters of bridges in poor condition: 5.8% (2,118 of 36,598 square meters of bridges)
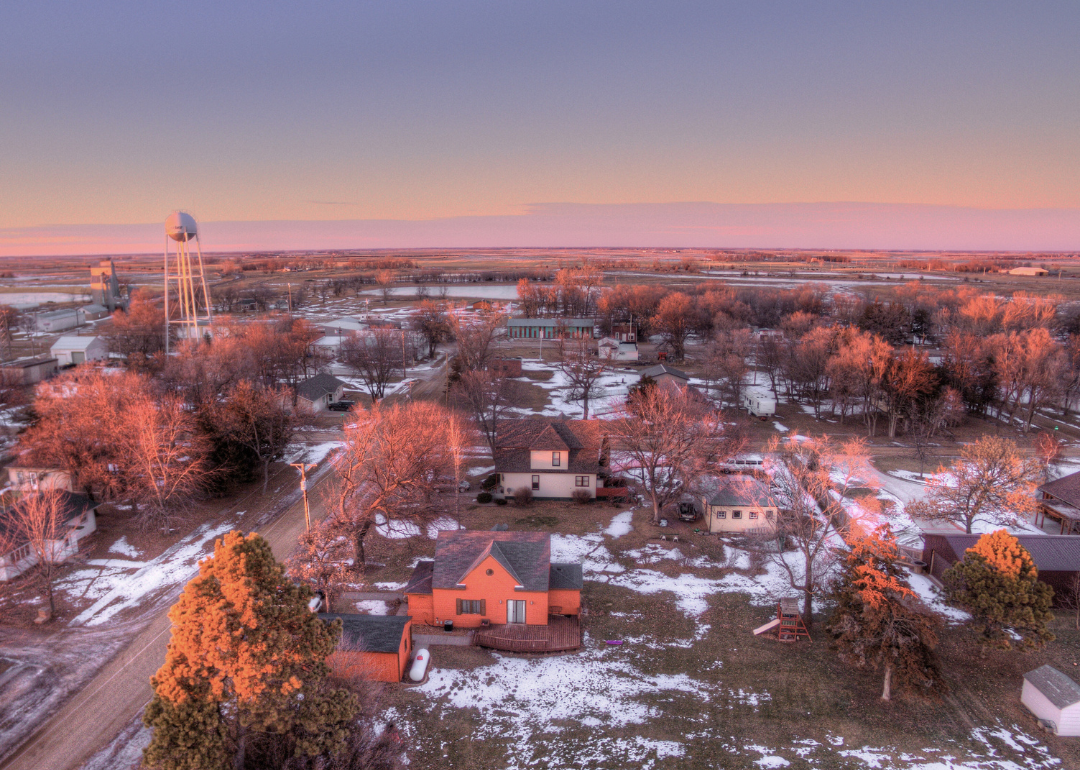
- Bridges in poor condition: 22.8% (13 of 57 bridges)
- Square meters of bridges in poor condition: 13.1% (1,998 of 15,284 square meters of bridges)
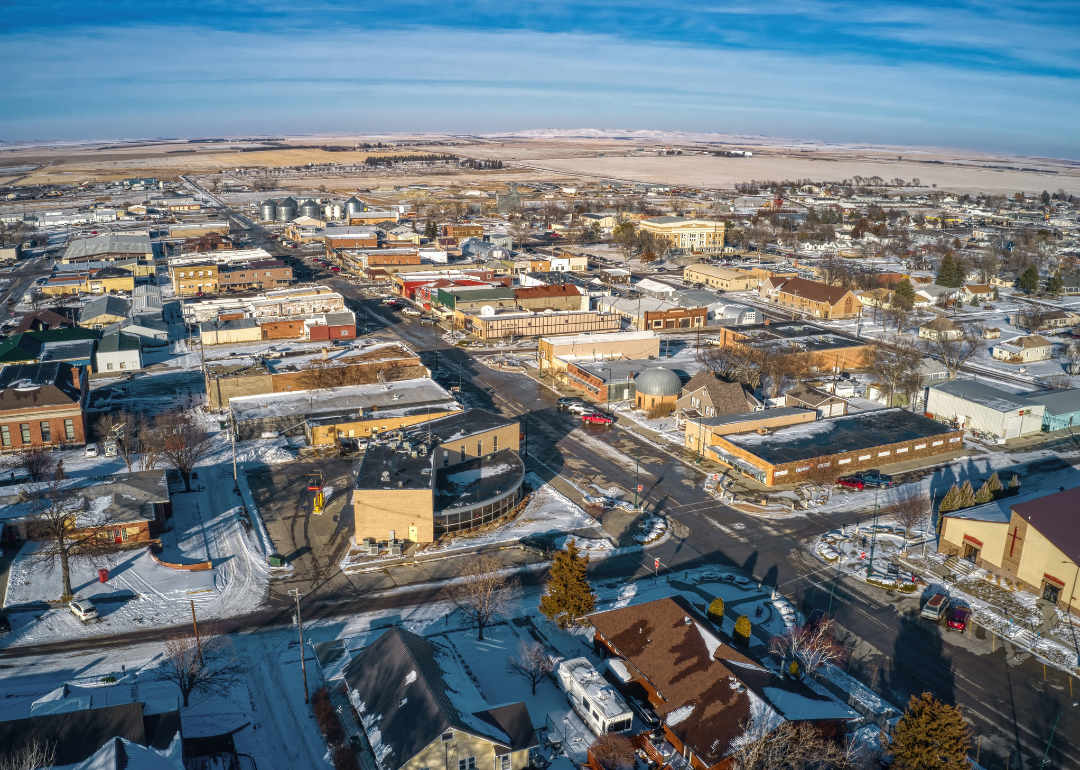
- Bridges in poor condition: 24.4% (22 of 90 bridges)
- Square meters of bridges in poor condition: 15.5% (2,675 of 17,256 square meters of bridges)
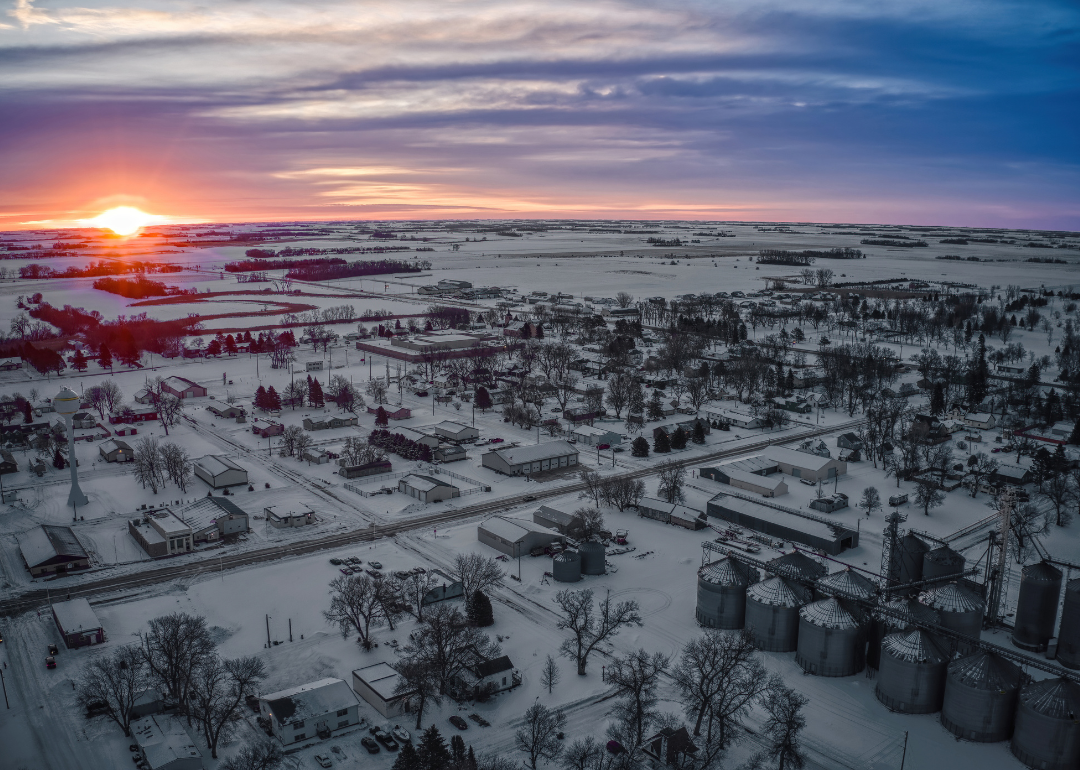
- Bridges in poor condition: 24.4% (22 of 90 bridges)
- Square meters of bridges in poor condition: 19.0% (6,232 of 32,739 square meters of bridges)
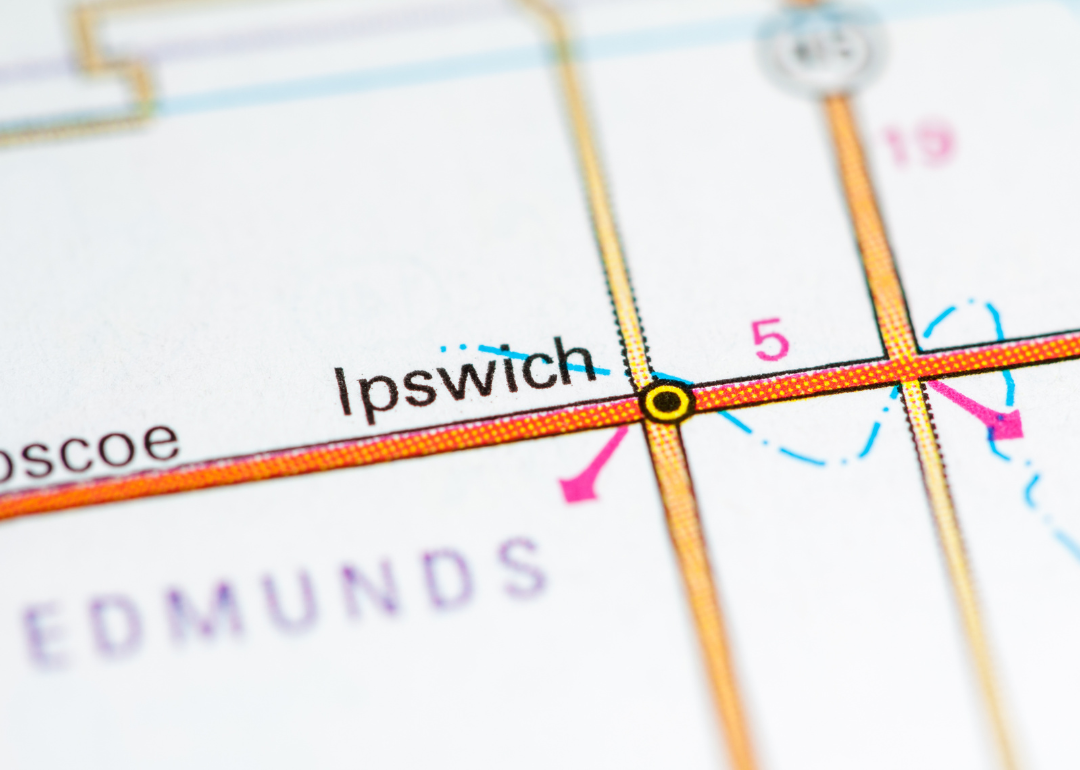
- Bridges in poor condition: 25.0% (5 of 20 bridges)
- Square meters of bridges in poor condition: 13.5% (764 of 5,640 square meters of bridges)
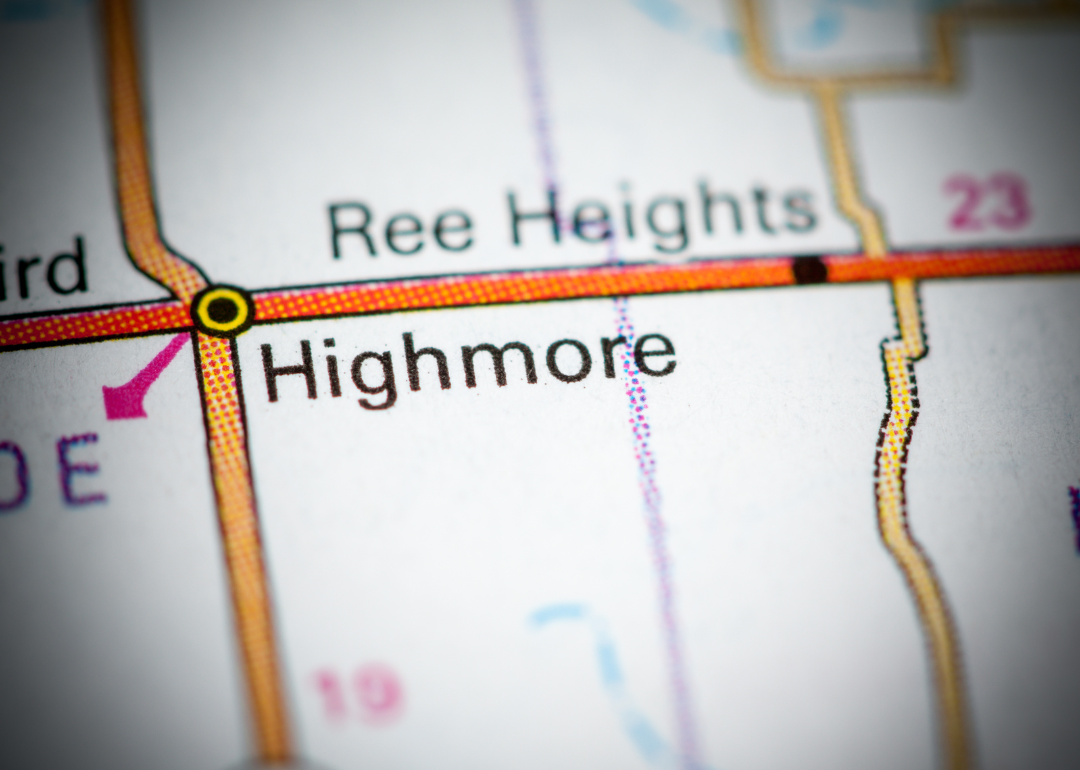
- Bridges in poor condition: 26.1% (6 of 23 bridges)
- Square meters of bridges in poor condition: 19.8% (433 of 2,185 square meters of bridges)

- Bridges in poor condition: 26.1% (41 of 157 bridges)
- Square meters of bridges in poor condition: 7.2% (3,141 of 43,583 square meters of bridges)
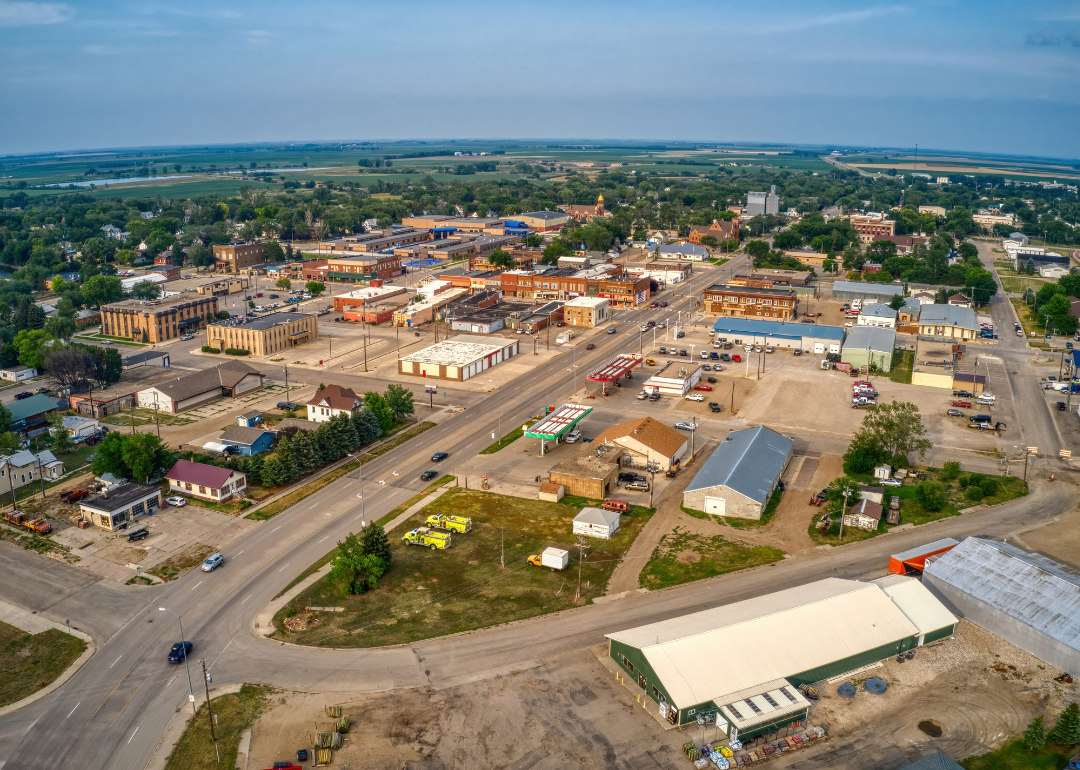
- Bridges in poor condition: 27.8% (49 of 176 bridges)
- Square meters of bridges in poor condition: 15.5% (6,597 of 42,567 square meters of bridges)
- Bridges in poor condition: 28.1% (36 of 128 bridges)
- Square meters of bridges in poor condition: 18.7% (2,241 of 11,989 square meters of bridges)
- Bridges in poor condition: 28.2% (11 of 39 bridges)
- Square meters of bridges in poor condition: 14.4% (629 of 4,354 square meters of bridges)
- Bridges in poor condition: 29.2% (7 of 24 bridges)
- Square meters of bridges in poor condition: 31.6% (1,926 of 6,096 square meters of bridges)
- Bridges in poor condition: 31.4% (11 of 35 bridges)
- Square meters of bridges in poor condition: 19.4% (619 of 3,192 square meters of bridges)

- Bridges in poor condition: 31.7% (20 of 63 bridges)
- Square meters of bridges in poor condition: 29.0% (1,924 of 6,624 square meters of bridges)
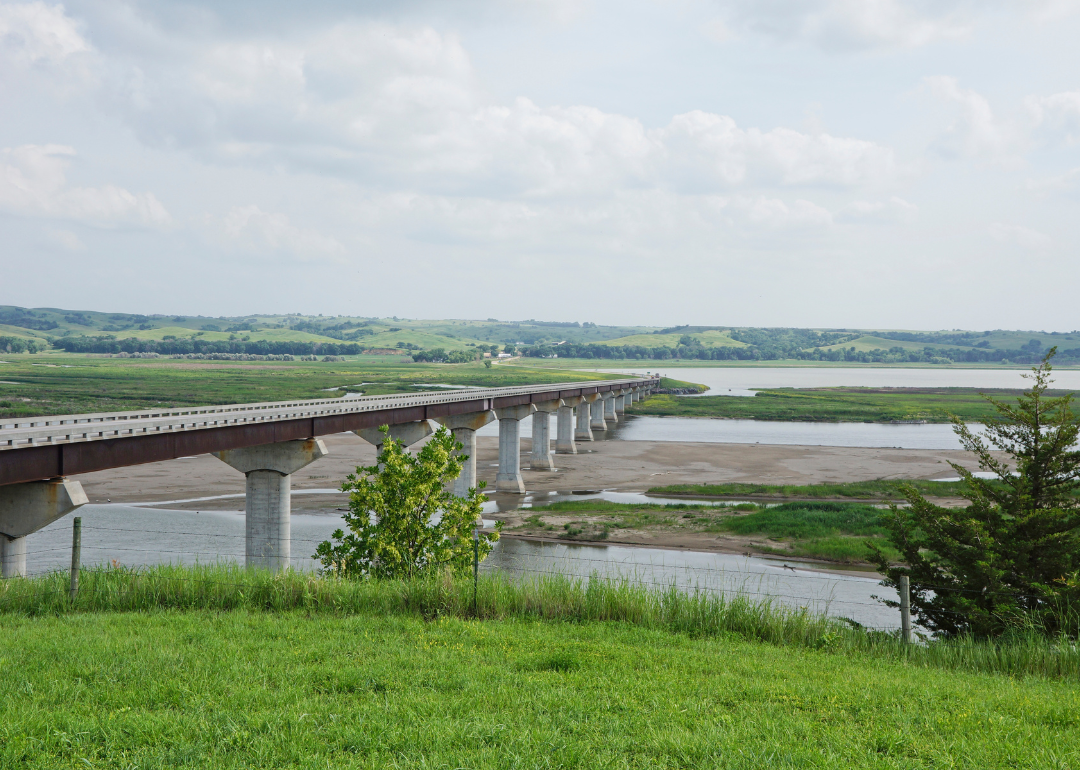
- Bridges in poor condition: 31.8% (41 of 129 bridges)
- Square meters of bridges in poor condition: 51.7% (14,034 of 27,166 square meters of bridges)
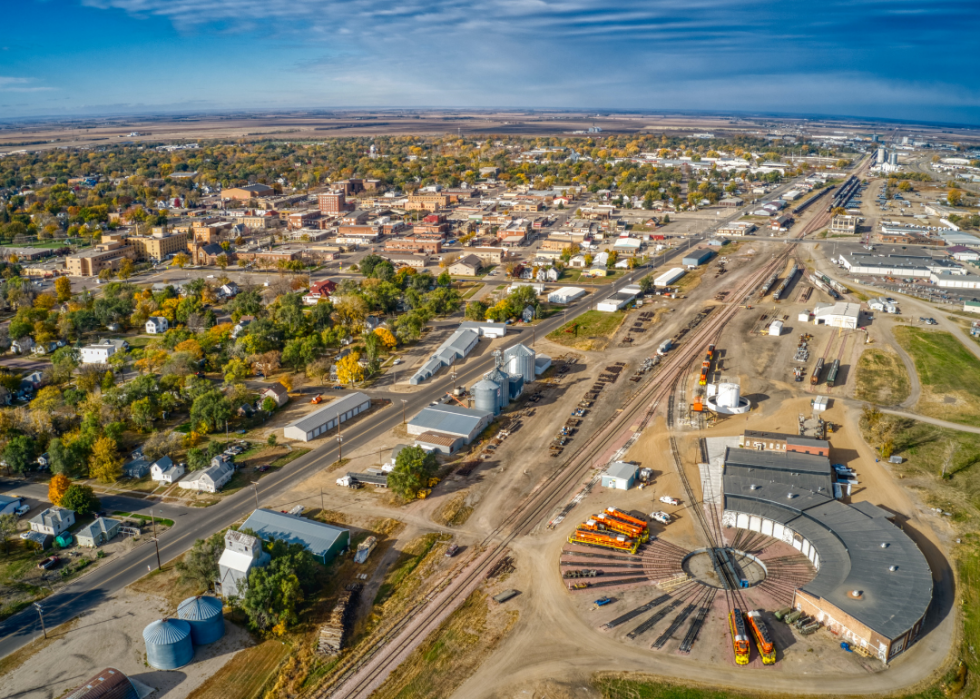
- Bridges in poor condition: 33.5% (52 of 155 bridges)
- Square meters of bridges in poor condition: 13.3% (4,264 of 32,008 square meters of bridges)
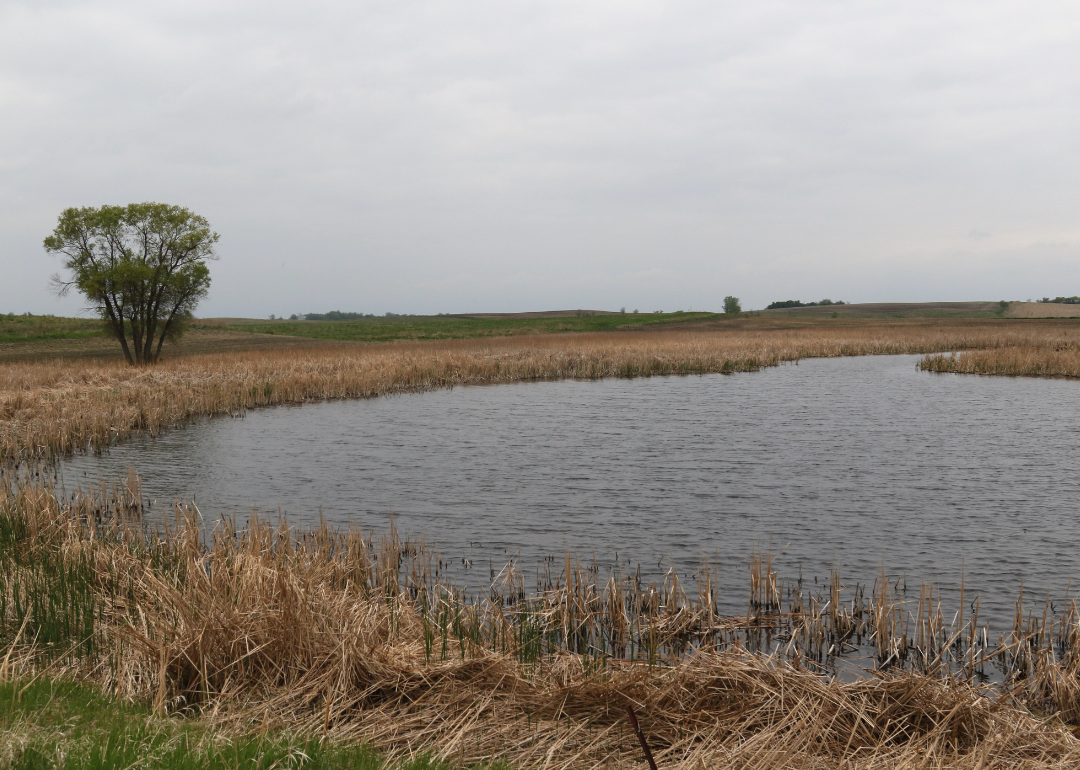
- Bridges in poor condition: 37.1% (13 of 35 bridges)
- Square meters of bridges in poor condition: 26.1% (964 of 3,696 square meters of bridges)
