Cities with the most expensive homes in the Cleveland, Tennessee metro area
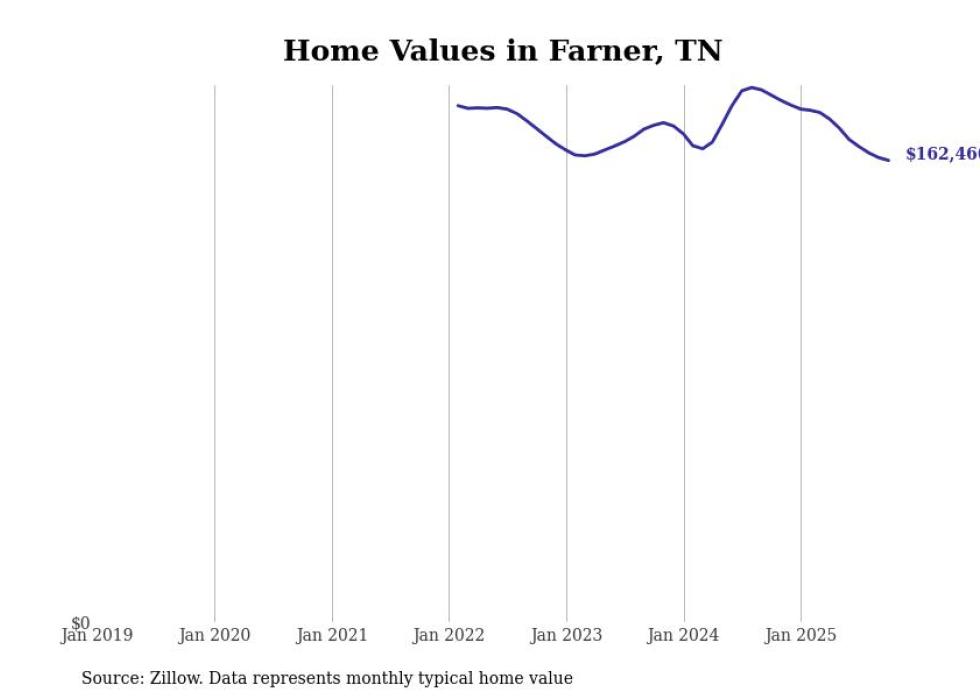
- Typical home value: $162,466
- 1-year price change: -12.4%
- 5-year price change: data not available
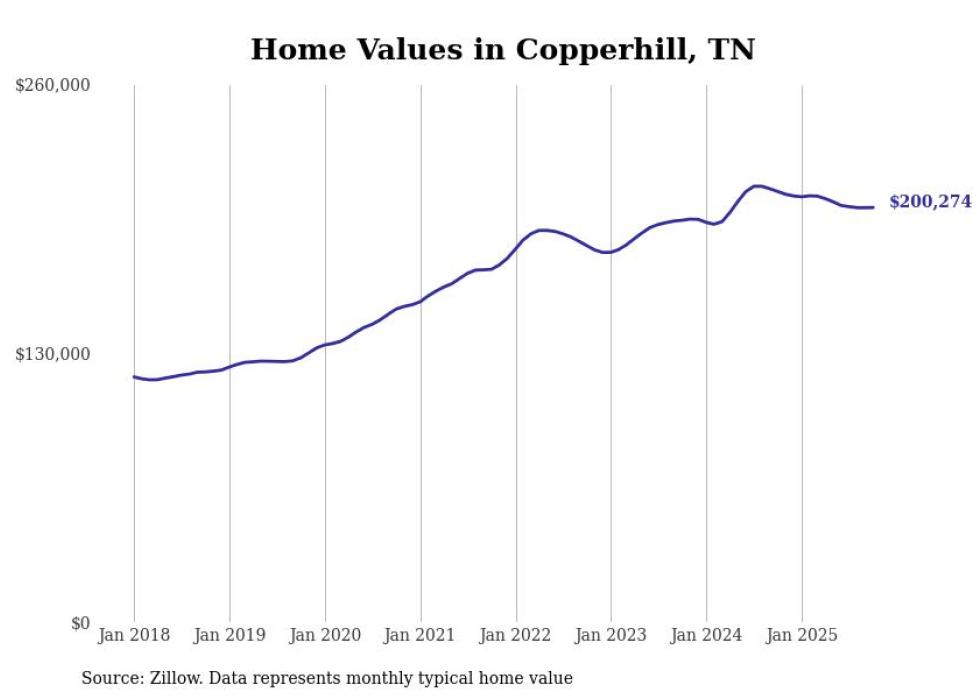
- Typical home value: $200,274
- 1-year price change: -3.7%
- 5-year price change: +32.4%
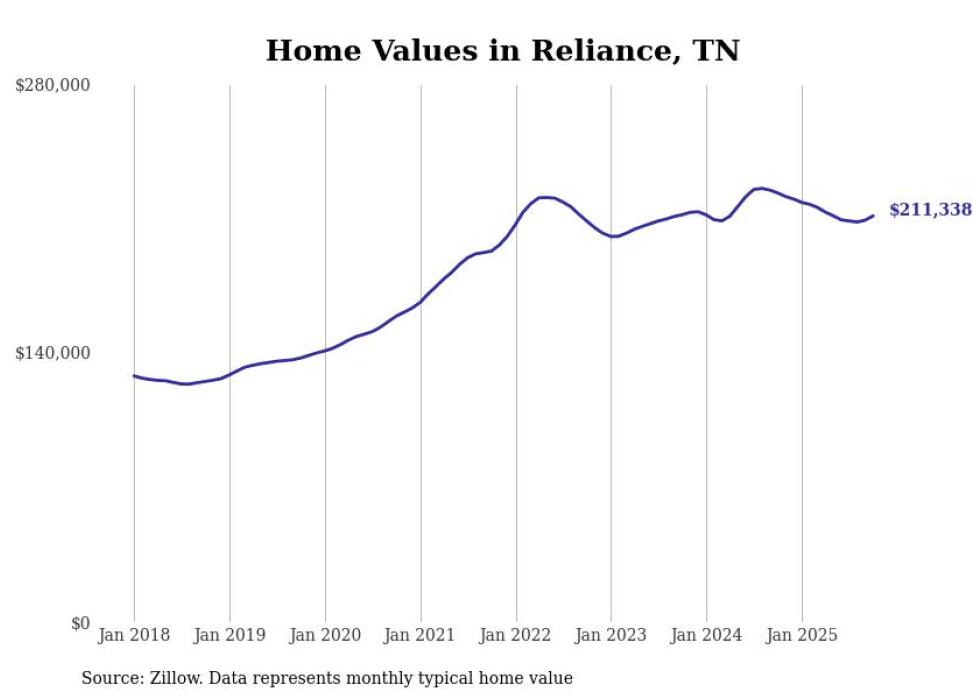
- Typical home value: $211,338
- 1-year price change: -5.3%
- 5-year price change: +32.8%
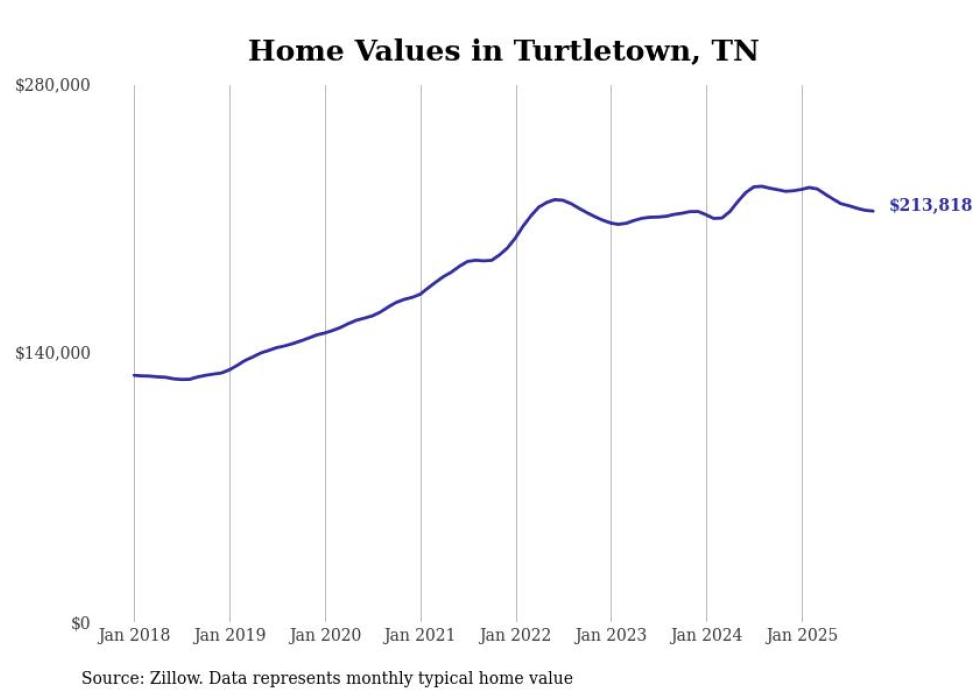
- Typical home value: $213,818
- 1-year price change: -4.9%
- 5-year price change: +28.6%
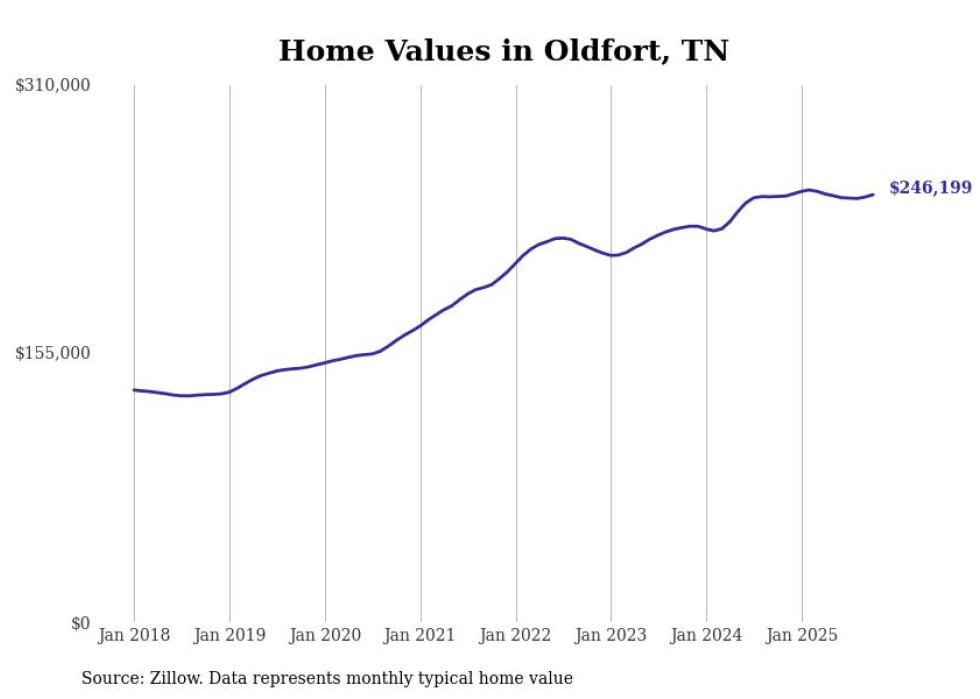
- Typical home value: $246,199
- 1-year price change: +0.4%
- 5-year price change: +51.8%
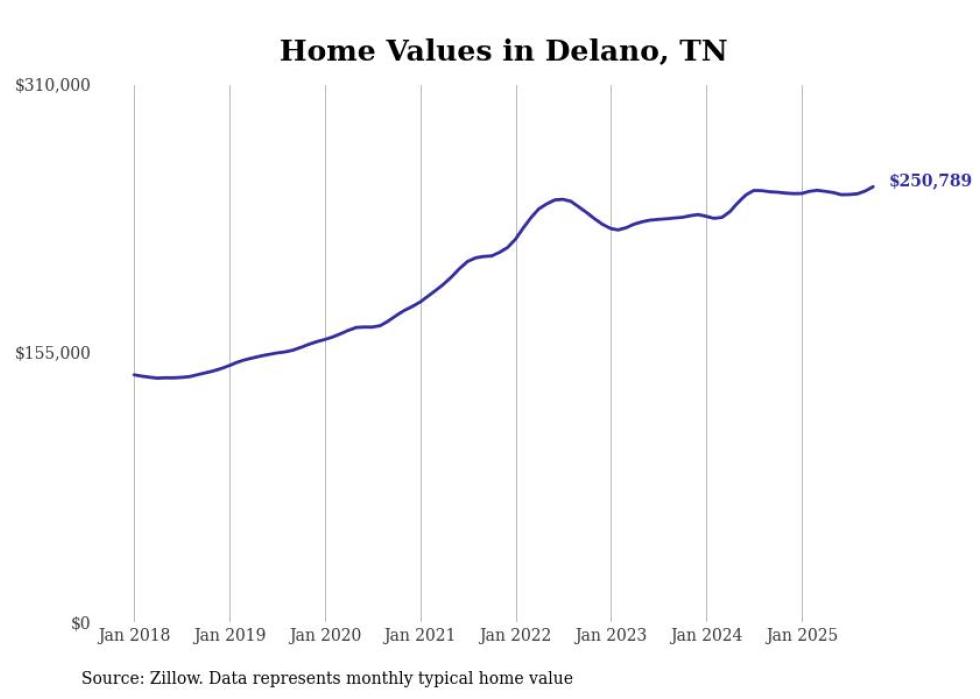
- Typical home value: $250,789
- 1-year price change: +1.3%
- 5-year price change: +42.0%
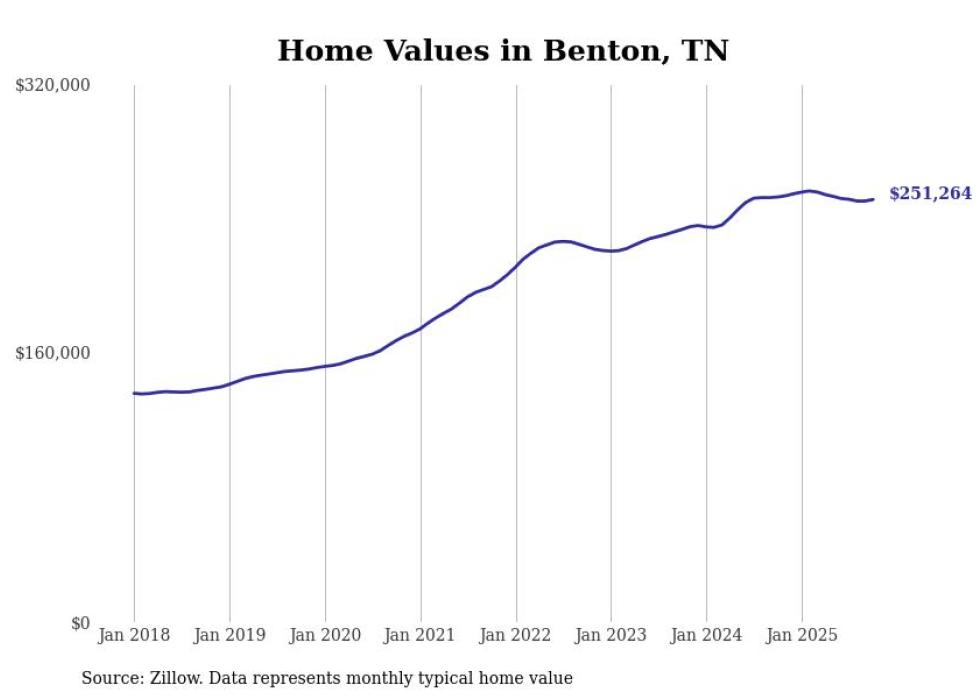
- Typical home value: $251,264
- 1-year price change: -0.6%
- 5-year price change: +50.1%
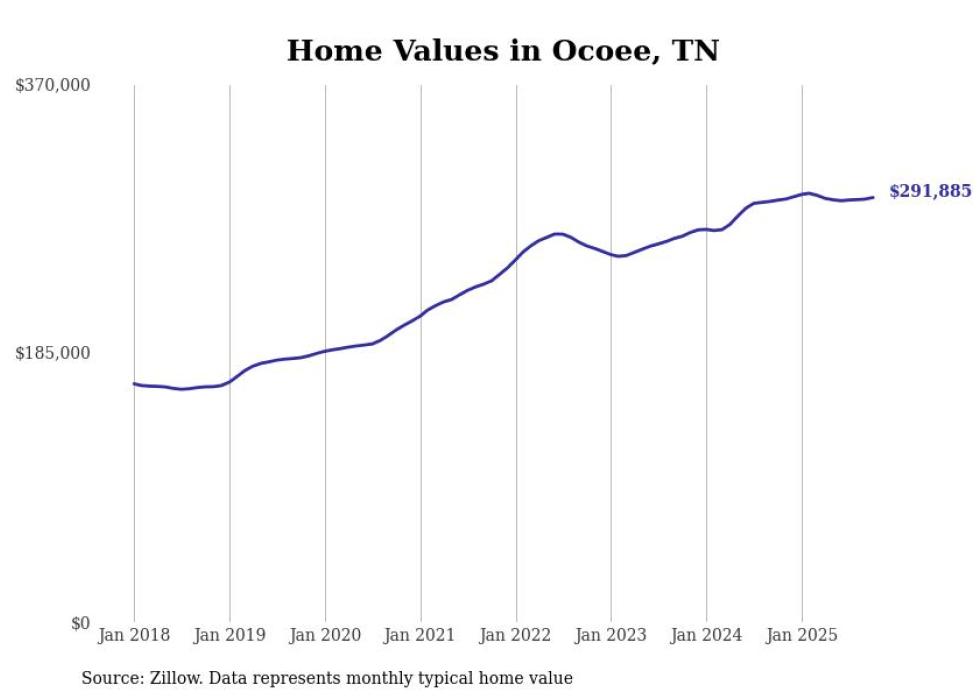
- Typical home value: $291,885
- 1-year price change: +0.6%
- 5-year price change: +45.3%
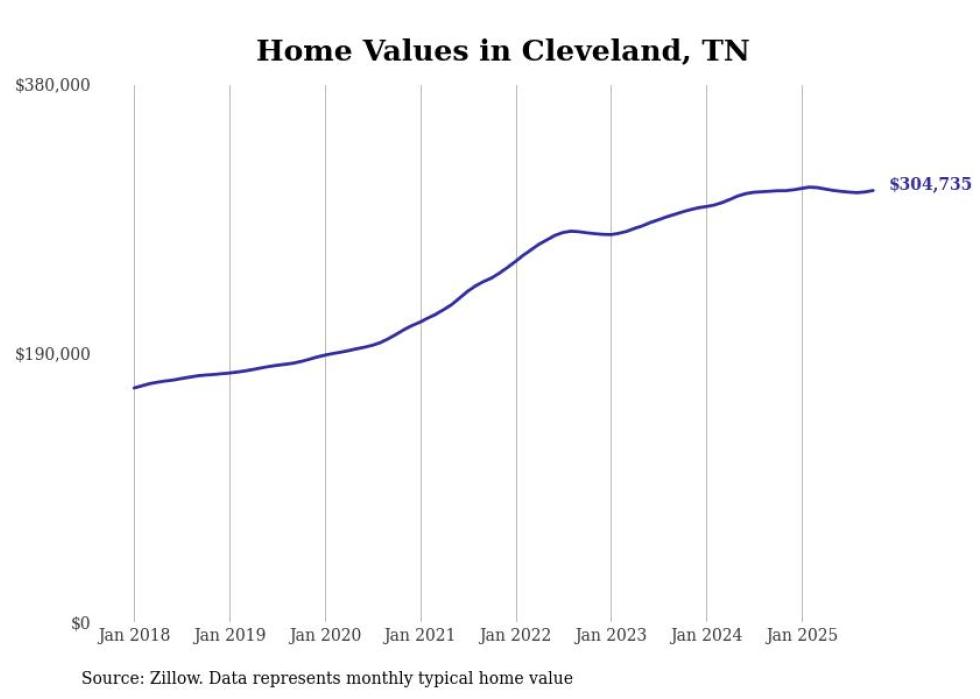
- Typical home value: $304,735
- 1-year price change: +0.1%
- 5-year price change: +50.0%
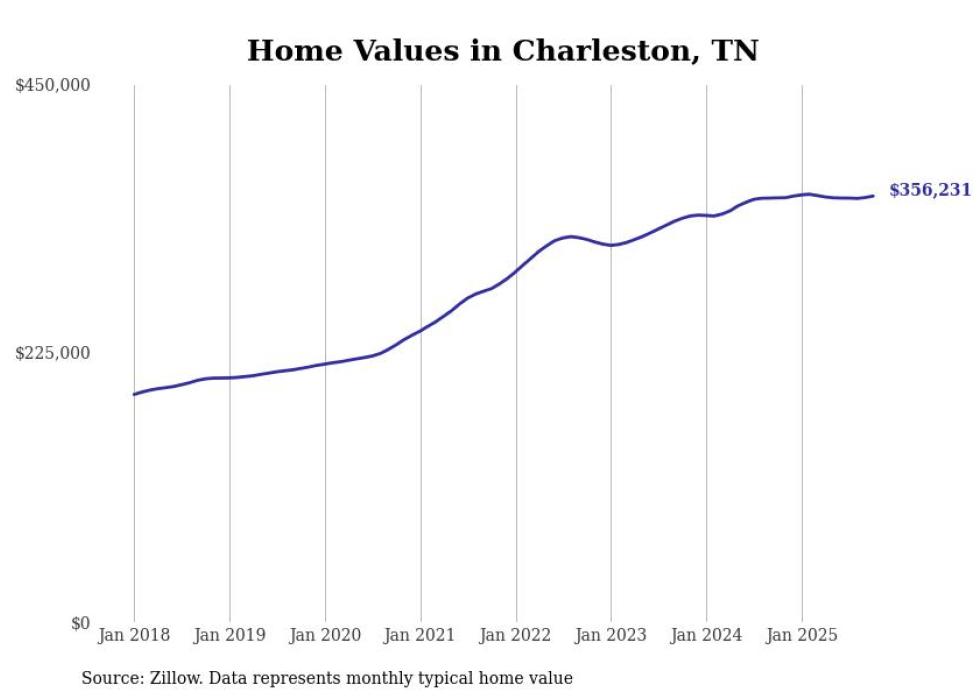
- Typical home value: $356,231
- 1-year price change: +0.4%
- 5-year price change: +53.6%
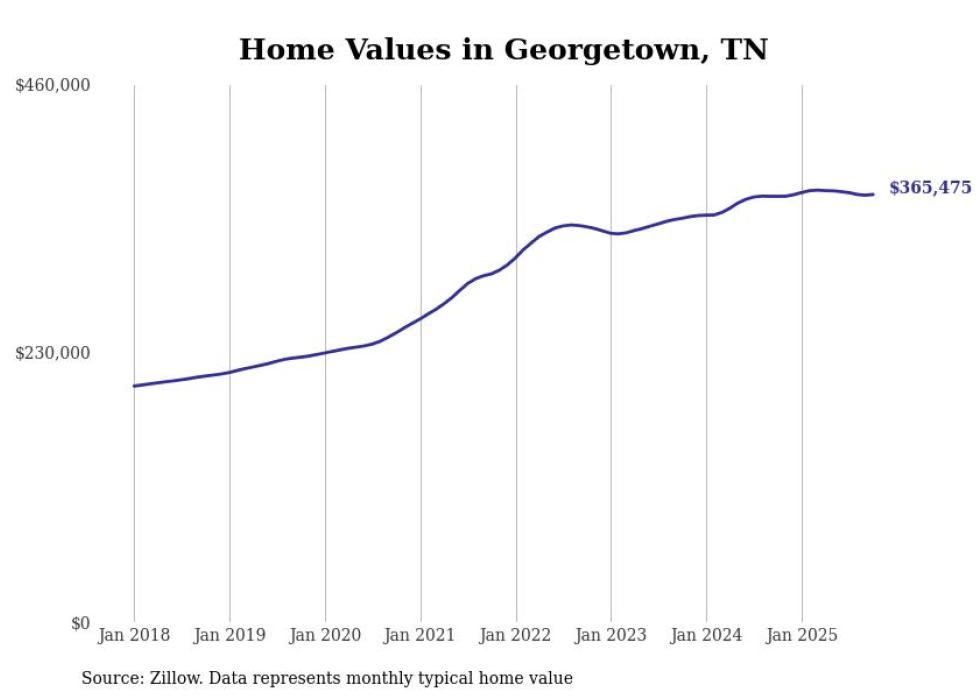
- Typical home value: $365,475
- 1-year price change: +0.4%
- 5-year price change: +47.8%
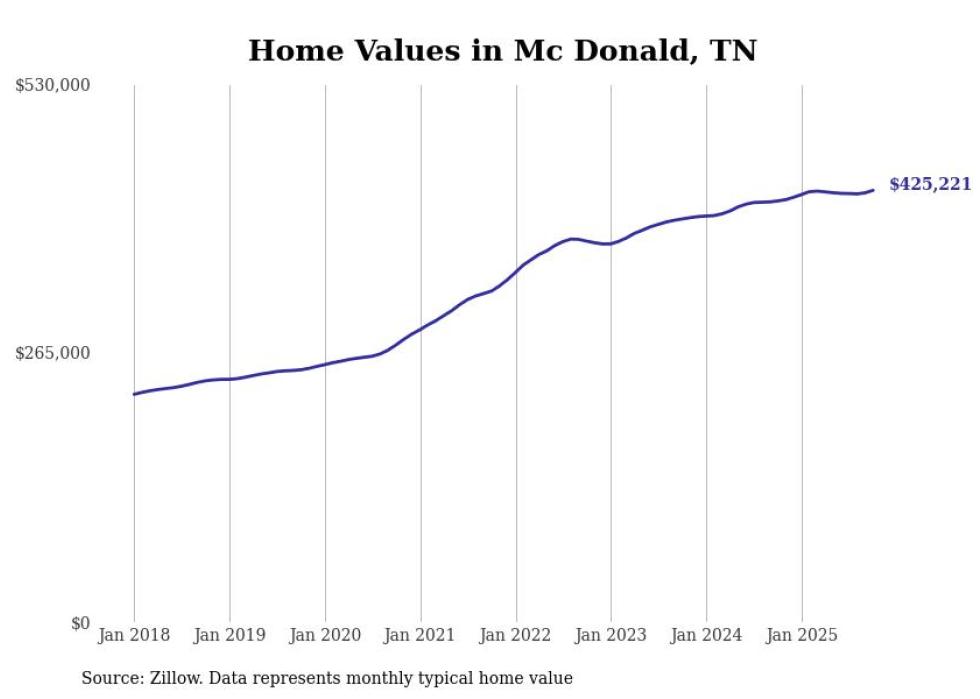
- Typical home value: $425,221
- 1-year price change: +2.5%
- 5-year price change: +55.7%