Counties with the highest rates of strokes in Tennessee

- Death rate for ischemic strokes, 2018-20: 28.6 per 100K people
- Death rate for hemorrhagic strokes, 2018-20: 9.2 per 100K people

- Death rate for ischemic strokes, 2018-20: 30.3 per 100K people
- Death rate for hemorrhagic strokes, 2018-20: 12.6 per 100K people

- Death rate for ischemic strokes, 2018-20: 20.8 per 100K people
- Death rate for hemorrhagic strokes, 2018-20: 9.2 per 100K people

- Death rate for ischemic strokes, 2018-20: 21.5 per 100K people
- Death rate for hemorrhagic strokes, 2018-20: 10.4 per 100K people

- Death rate for ischemic strokes, 2018-20: 21.7 per 100K people
- Death rate for hemorrhagic strokes, 2018-20: 8.4 per 100K people
You may also like: See how low property taxes in Tennessee are
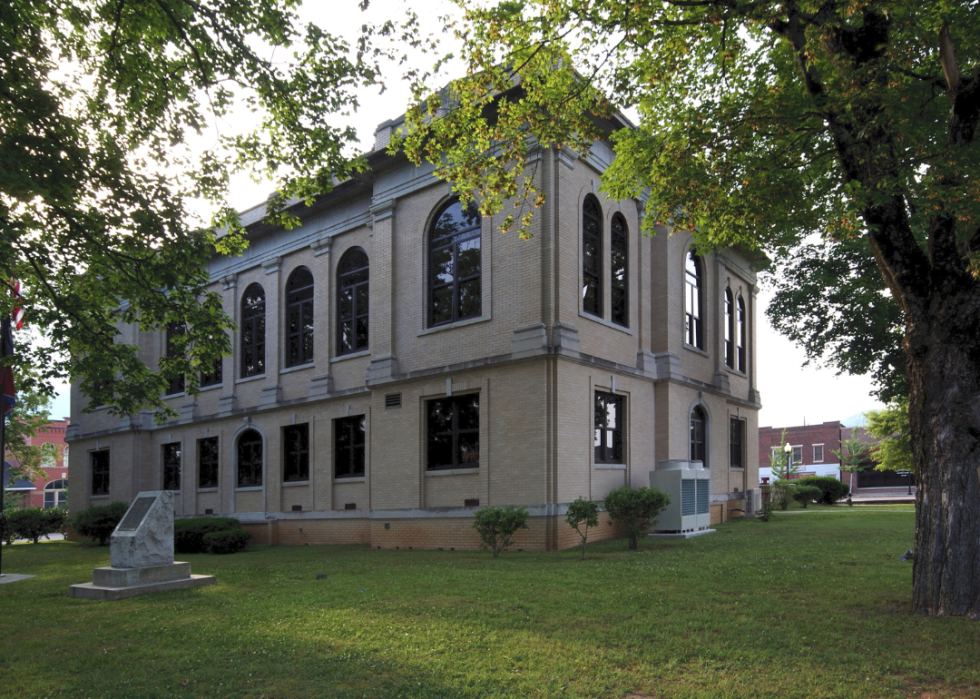
- Death rate for ischemic strokes, 2018-20: 21.9 per 100K people
- Death rate for hemorrhagic strokes, 2018-20: 9.9 per 100K people

- Death rate for ischemic strokes, 2018-20: 23.9 per 100K people
- Death rate for hemorrhagic strokes, 2018-20: 12.7 per 100K people

- Death rate for ischemic strokes, 2018-20: 25.3 per 100K people
- Death rate for hemorrhagic strokes, 2018-20: 13.5 per 100K people

- Death rate for ischemic strokes, 2018-20: 25.8 per 100K people
- Death rate for hemorrhagic strokes, 2018-20: 13.6 per 100K people

- Death rate for ischemic strokes, 2018-20: 26.3 per 100K people
- Death rate for hemorrhagic strokes, 2018-20: 8.0 per 100K people
You may also like: Counties with the oldest homes in Tennessee

- Death rate for ischemic strokes, 2018-20: 26.6 per 100K people
- Death rate for hemorrhagic strokes, 2018-20: 12.0 per 100K people

- Death rate for ischemic strokes, 2018-20: 26.8 per 100K people
- Death rate for hemorrhagic strokes, 2018-20: 11.7 per 100K people

- Death rate for ischemic strokes, 2018-20: 27.5 per 100K people
- Death rate for hemorrhagic strokes, 2018-20: 11.9 per 100K people
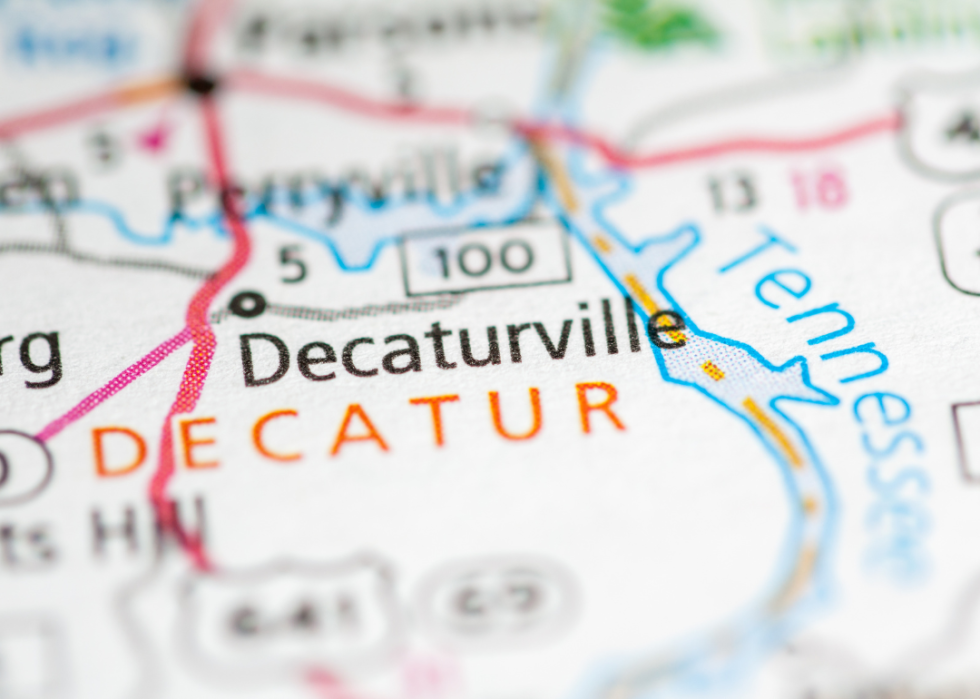
- Death rate for ischemic strokes, 2018-20: 27.6 per 100K people
- Death rate for hemorrhagic strokes, 2018-20: 13.8 per 100K people

- Death rate for ischemic strokes, 2018-20: 27.9 per 100K people
- Death rate for hemorrhagic strokes, 2018-20: 13.3 per 100K people
You may also like: Counties in Tennessee where people spend most of their paycheck on housing
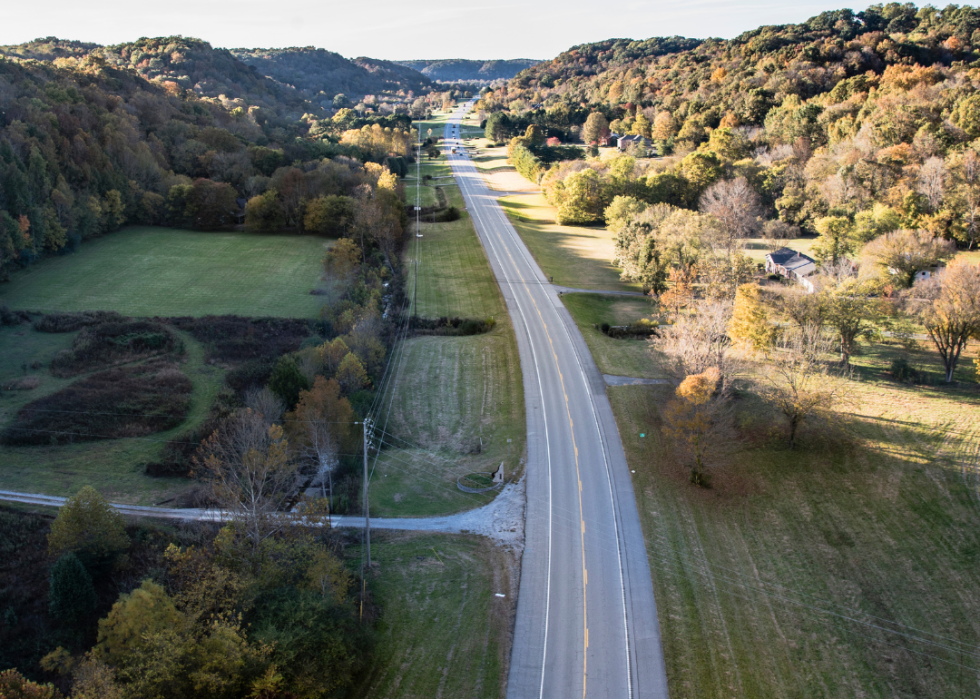
- Death rate for ischemic strokes, 2018-20: 28.6 per 100K people
- Death rate for hemorrhagic strokes, 2018-20: 10.0 per 100K people

- Death rate for ischemic strokes, 2018-20: 22.1 per 100K people
- Death rate for hemorrhagic strokes, 2018-20: 12.8 per 100K people

- Death rate for ischemic strokes, 2018-20: 22.5 per 100K people
- Death rate for hemorrhagic strokes, 2018-20: 11.7 per 100K people

- Death rate for ischemic strokes, 2018-20: 23.1 per 100K people
- Death rate for hemorrhagic strokes, 2018-20: 10.6 per 100K people

- Death rate for ischemic strokes, 2018-20: 24.4 per 100K people
- Death rate for hemorrhagic strokes, 2018-20: 9.7 per 100K people
You may also like: Counties with the most super commuters in Tennessee

- Death rate for ischemic strokes, 2018-20: 24.4 per 100K people
- Death rate for hemorrhagic strokes, 2018-20: 12.3 per 100K people

- Death rate for ischemic strokes, 2018-20: 24.5 per 100K people
- Death rate for hemorrhagic strokes, 2018-20: 9.0 per 100K people
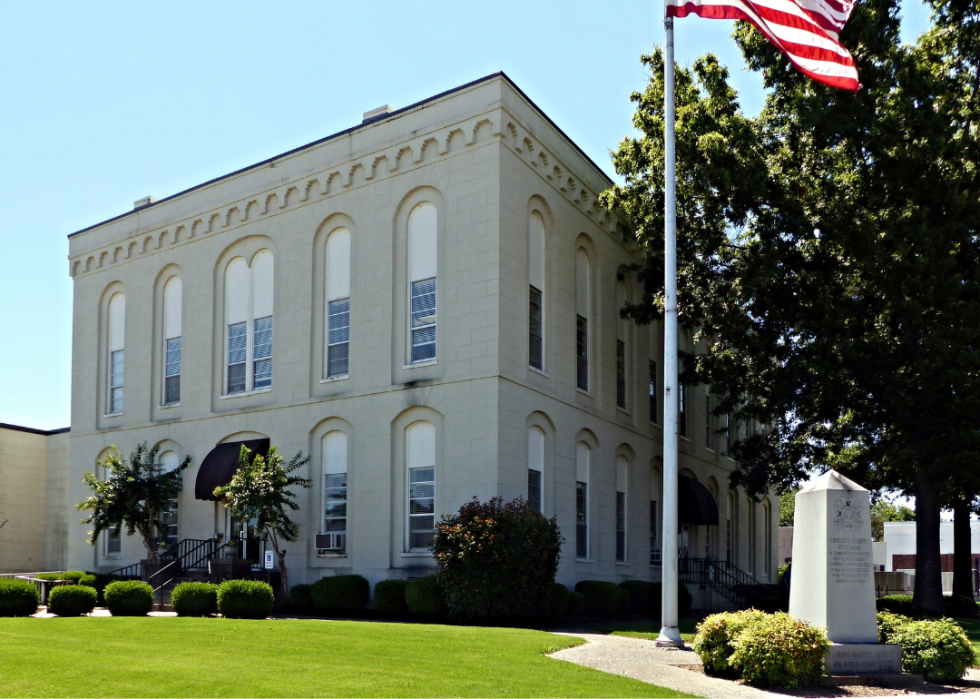
- Death rate for ischemic strokes, 2018-20: 24.9 per 100K people
- Death rate for hemorrhagic strokes, 2018-20: 11.9 per 100K people

- Death rate for ischemic strokes, 2018-20: 25.2 per 100K people
- Death rate for hemorrhagic strokes, 2018-20: 12.0 per 100K people

- Death rate for ischemic strokes, 2018-20: 25.4 per 100K people
- Death rate for hemorrhagic strokes, 2018-20: 14.3 per 100K people
You may also like: Highest-rated museums in Tennessee
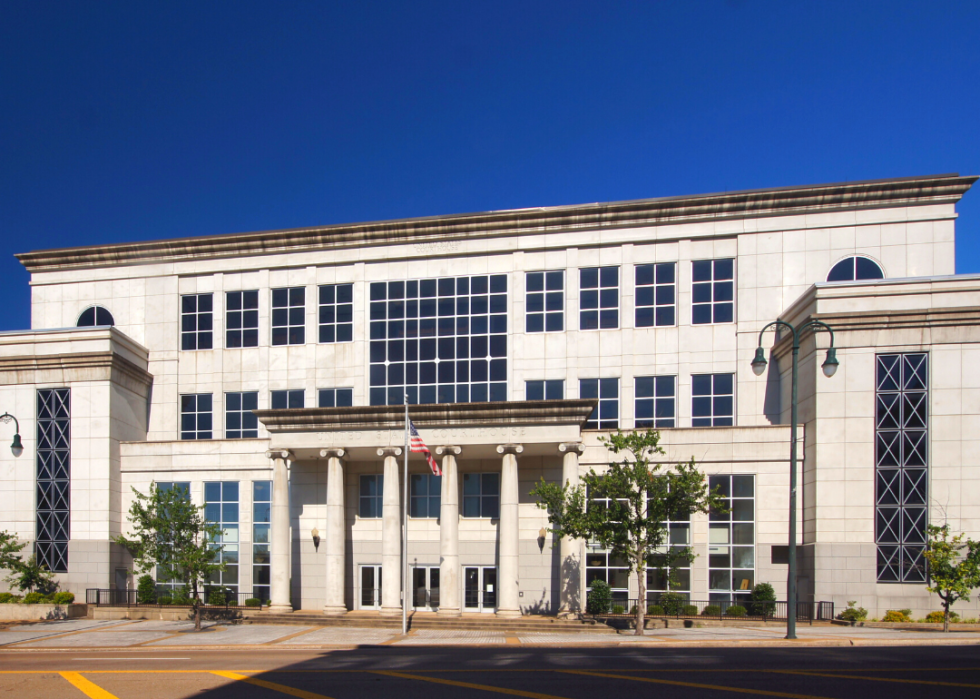
- Death rate for ischemic strokes, 2018-20: 26.2 per 100K people
- Death rate for hemorrhagic strokes, 2018-20: 12.2 per 100K people

- Death rate for ischemic strokes, 2018-20: 26.7 per 100K people
- Death rate for hemorrhagic strokes, 2018-20: 11.6 per 100K people

- Death rate for ischemic strokes, 2018-20: 27.6 per 100K people
- Death rate for hemorrhagic strokes, 2018-20: 11.3 per 100K people
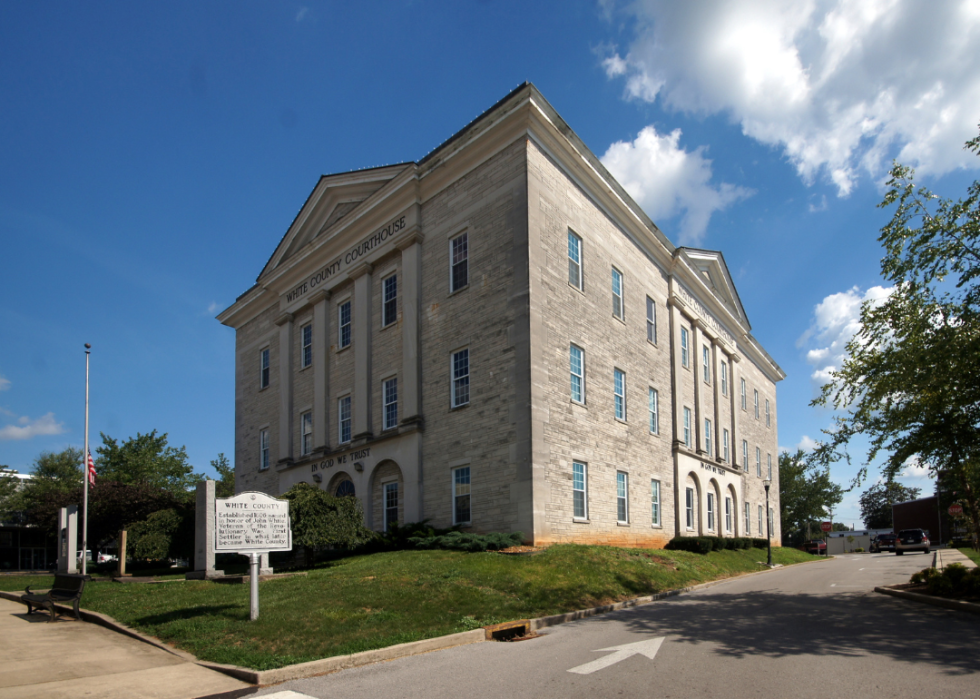
- Death rate for ischemic strokes, 2018-20: 28.7 per 100K people
- Death rate for hemorrhagic strokes, 2018-20: 9.8 per 100K people
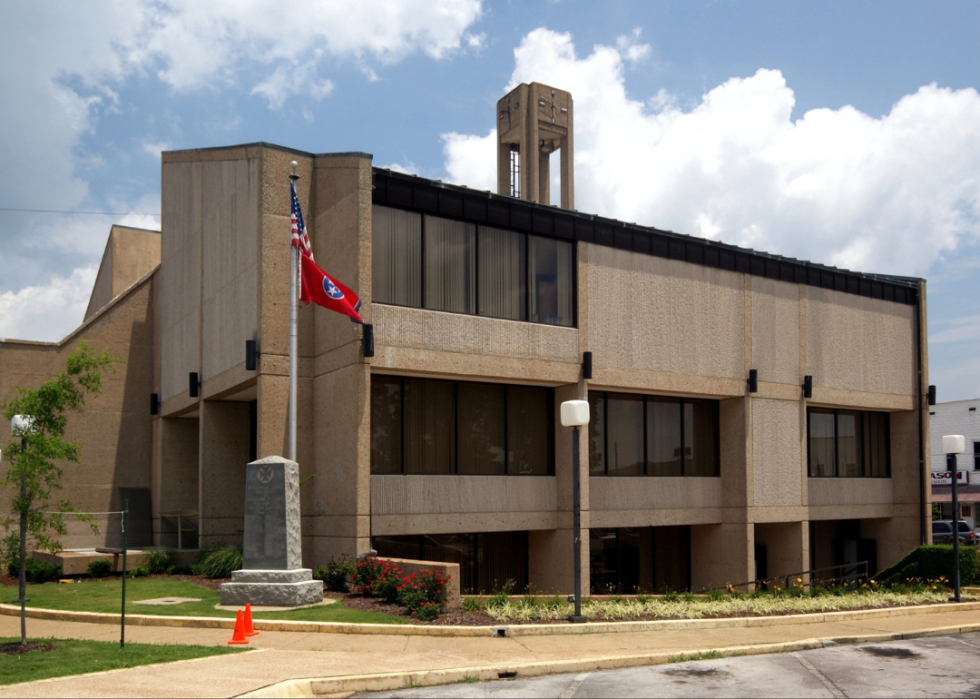
- Death rate for ischemic strokes, 2018-20: 29.0 per 100K people
- Death rate for hemorrhagic strokes, 2018-20: 10.5 per 100K people
You may also like: Counties most concerned about climate change in Tennessee

- Death rate for ischemic strokes, 2018-20: 29.3 per 100K people
- Death rate for hemorrhagic strokes, 2018-20: 10.6 per 100K people

- Death rate for ischemic strokes, 2018-20: 29.5 per 100K people
- Death rate for hemorrhagic strokes, 2018-20: 12.0 per 100K people

- Death rate for ischemic strokes, 2018-20: 30.2 per 100K people
- Death rate for hemorrhagic strokes, 2018-20: 13.1 per 100K people

- Death rate for ischemic strokes, 2018-20: 20.8 per 100K people
- Death rate for hemorrhagic strokes, 2018-20: 9.0 per 100K people
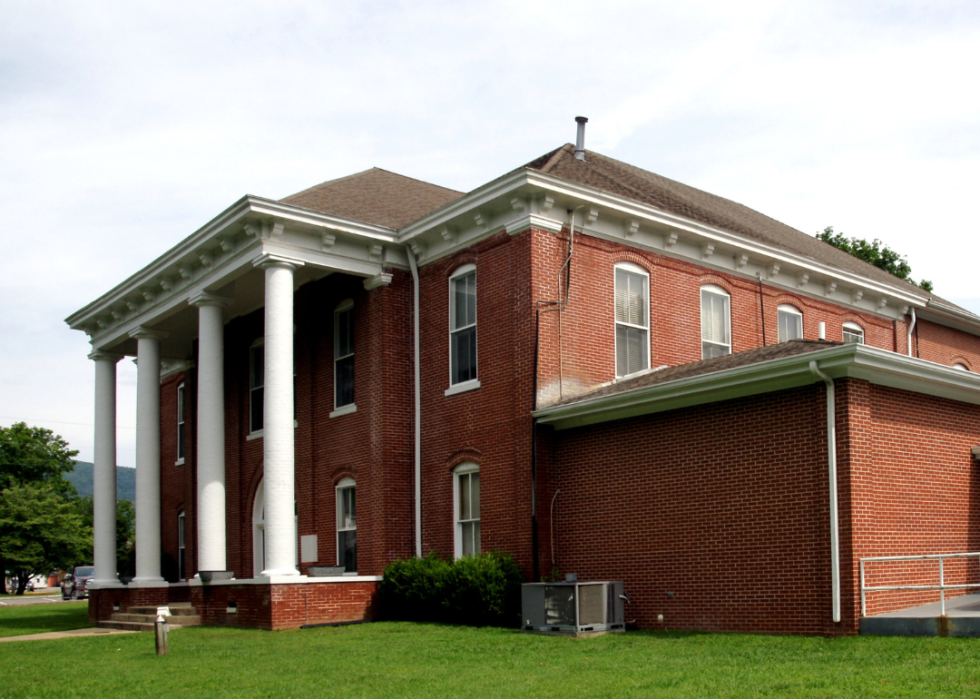
- Death rate for ischemic strokes, 2018-20: 21.8 per 100K people
- Death rate for hemorrhagic strokes, 2018-20: 9.3 per 100K people
You may also like: Most rural counties in Tennessee

- Death rate for ischemic strokes, 2018-20: 22.2 per 100K people
- Death rate for hemorrhagic strokes, 2018-20: 10.1 per 100K people

- Death rate for ischemic strokes, 2018-20: 22.4 per 100K people
- Death rate for hemorrhagic strokes, 2018-20: 9.6 per 100K people

- Death rate for ischemic strokes, 2018-20: 23.8 per 100K people
- Death rate for hemorrhagic strokes, 2018-20: 11.7 per 100K people

- Death rate for ischemic strokes, 2018-20: 27.6 per 100K people
- Death rate for hemorrhagic strokes, 2018-20: 8.3 per 100K people

- Death rate for ischemic strokes, 2018-20: 28.4 per 100K people
- Death rate for hemorrhagic strokes, 2018-20: 10.2 per 100K people
You may also like: Integration begins in Clinton: A major civil rights moment in Tennessee

- Death rate for ischemic strokes, 2018-20: 30.9 per 100K people
- Death rate for hemorrhagic strokes, 2018-20: 10.8 per 100K people
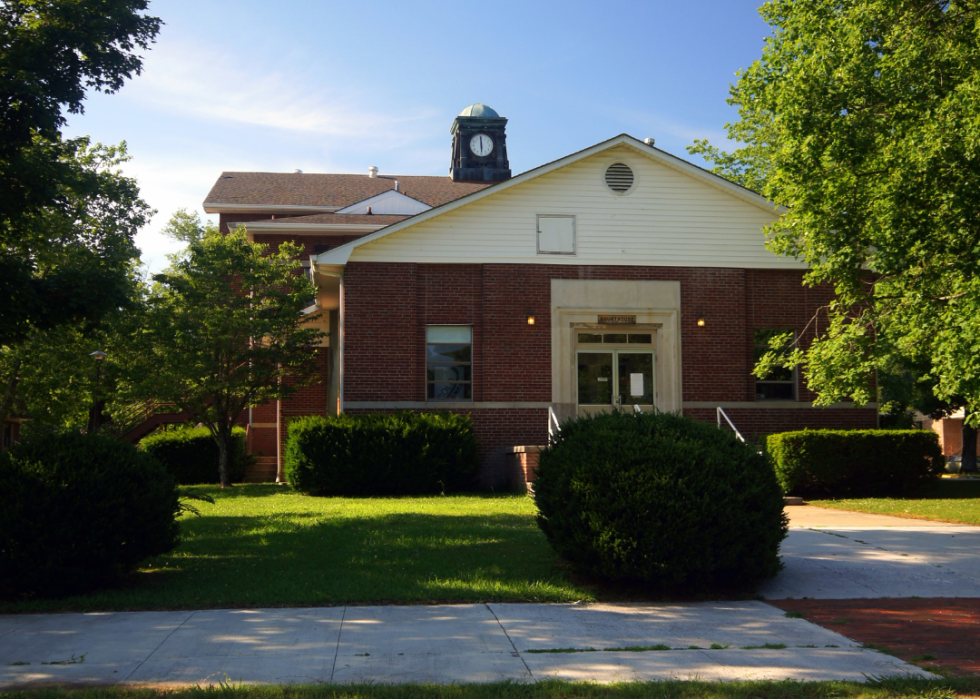
- Death rate for ischemic strokes, 2018-20: 25.5 per 100K people
- Death rate for hemorrhagic strokes, 2018-20: 11.8 per 100K people

- Death rate for ischemic strokes, 2018-20: 25.7 per 100K people
- Death rate for hemorrhagic strokes, 2018-20: 15.1 per 100K people

- Death rate for ischemic strokes, 2018-20: 27.8 per 100K people
- Death rate for hemorrhagic strokes, 2018-20: 12.1 per 100K people

- Death rate for ischemic strokes, 2018-20: 29.9 per 100K people
- Death rate for hemorrhagic strokes, 2018-20: 11.3 per 100K people
You may also like: Best colleges in Tennessee

- Death rate for ischemic strokes, 2018-20: 23.4 per 100K people
- Death rate for hemorrhagic strokes, 2018-20: 10.2 per 100K people

- Death rate for ischemic strokes, 2018-20: 24.1 per 100K people
- Death rate for hemorrhagic strokes, 2018-20: 13.2 per 100K people

- Death rate for ischemic strokes, 2018-20: 27.4 per 100K people
- Death rate for hemorrhagic strokes, 2018-20: 11.6 per 100K people

- Death rate for ischemic strokes, 2018-20: 25.0 per 100K people
- Death rate for hemorrhagic strokes, 2018-20: 11.5 per 100K people

- Death rate for ischemic strokes, 2018-20: 24.8 per 100K people
- Death rate for hemorrhagic strokes, 2018-20: 13.1 per 100K people
You may also like: Best school districts in Tennessee
This story features data reporting and writing by Emma Rubin and is part of a series utilizing data automation across 49 states.
