Counties with the most bridges in dire need of repair in Tennessee
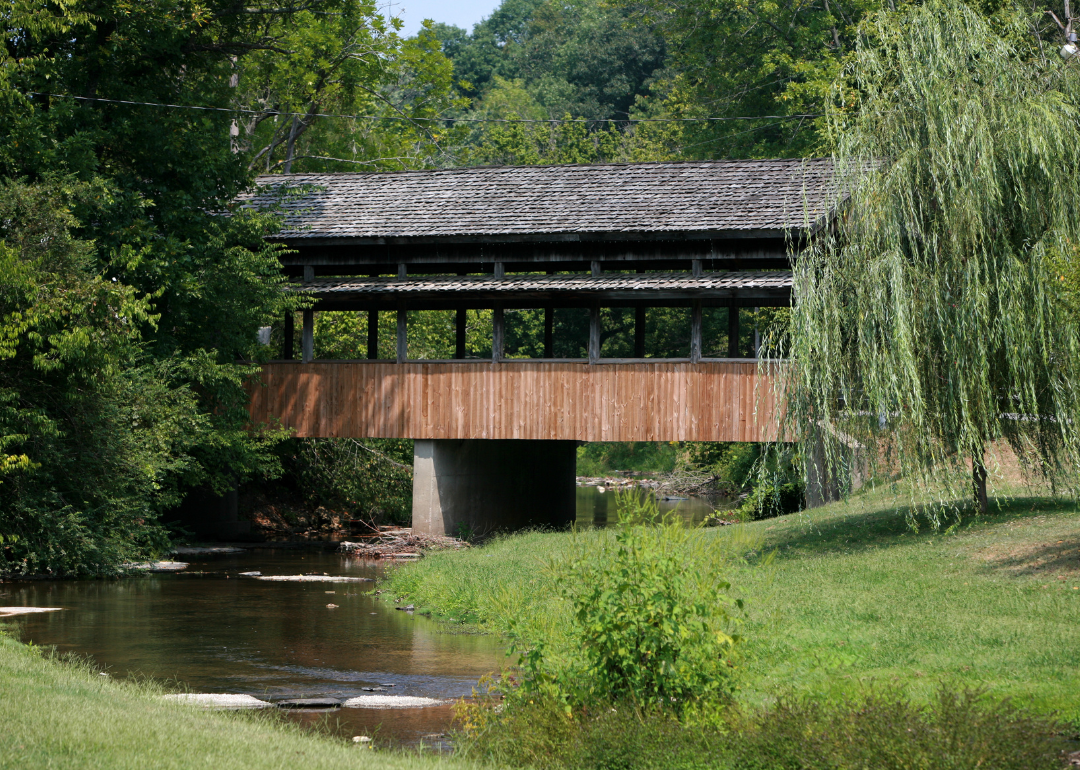
- Bridges in poor condition: 6.5% (11 of 169 bridges)
- Square meters of bridges in poor condition: 5.1% (1,628 of 31,943 square meters of bridges)
- Bridges in poor condition: 6.6% (4 of 61 bridges)
- Square meters of bridges in poor condition: 1.4% (225 of 16,344 square meters of bridges)

- Bridges in poor condition: 7.1% (24 of 337 bridges)
- Square meters of bridges in poor condition: 2.5% (3,256 of 128,667 square meters of bridges)
- Bridges in poor condition: 7.2% (29 of 402 bridges)
- Square meters of bridges in poor condition: 11.4% (17,284 of 151,253 square meters of bridges)
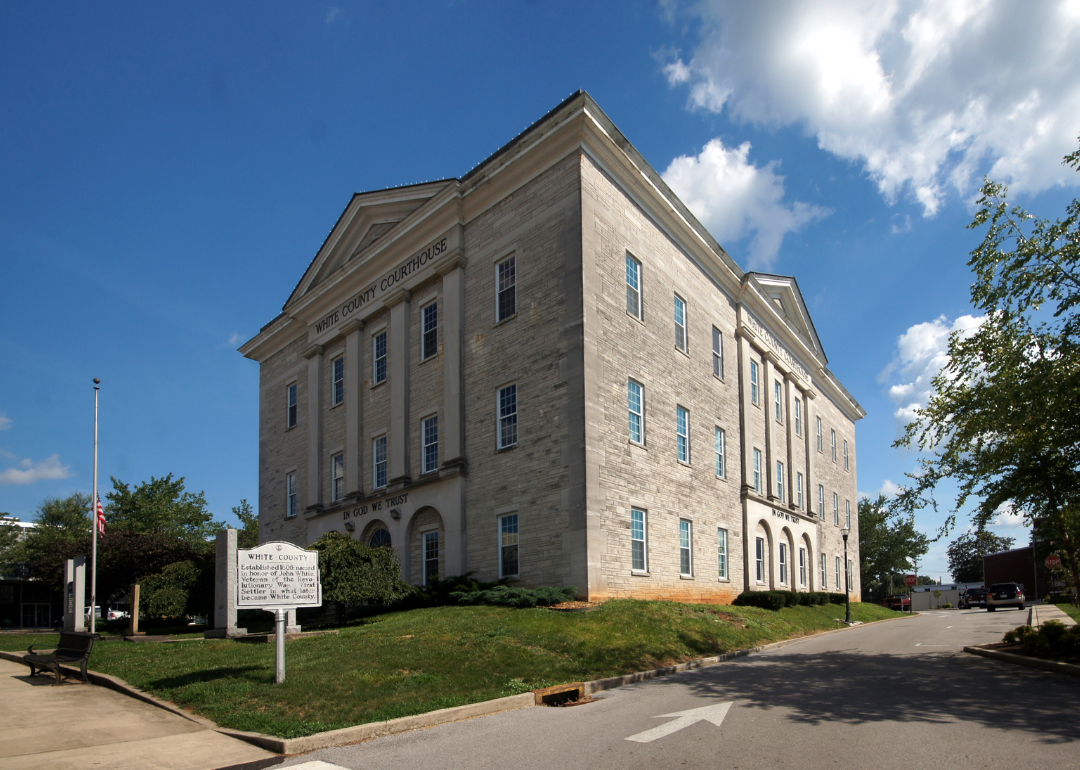
- Bridges in poor condition: 7.2% (5 of 69 bridges)
- Square meters of bridges in poor condition: 9.0% (3,973 of 44,377 square meters of bridges)
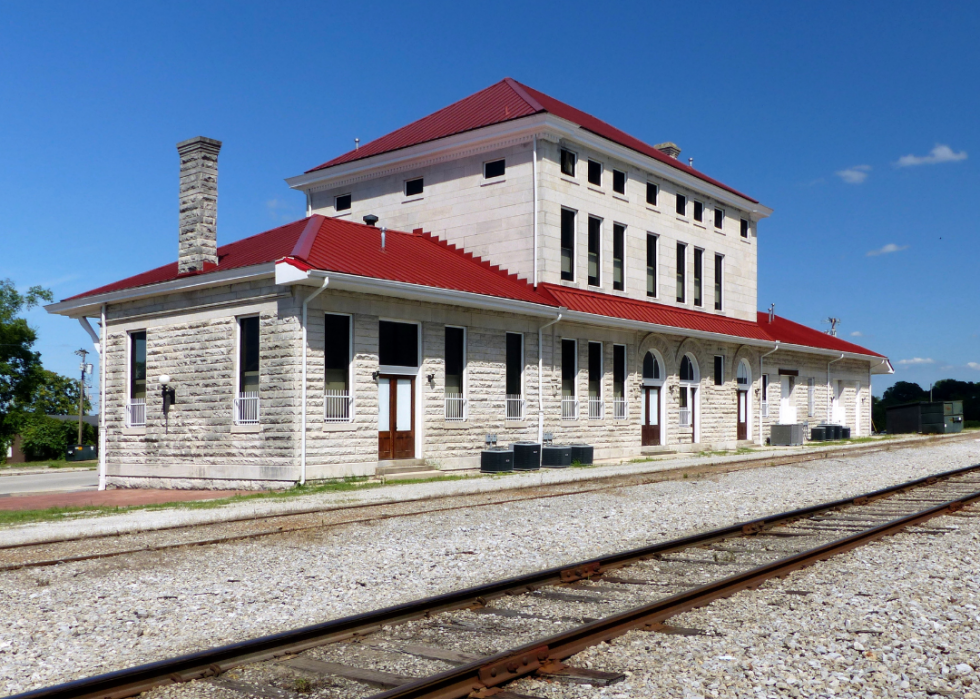
- Bridges in poor condition: 7.5% (32 of 427 bridges)
- Square meters of bridges in poor condition: 5.9% (10,108 of 170,212 square meters of bridges)

- Bridges in poor condition: 7.5% (9 of 120 bridges)
- Square meters of bridges in poor condition: 2.2% (898 of 41,047 square meters of bridges)

- Bridges in poor condition: 7.7% (20 of 261 bridges)
- Square meters of bridges in poor condition: 8.6% (6,751 of 78,747 square meters of bridges)

- Bridges in poor condition: 8.1% (13 of 160 bridges)
- Square meters of bridges in poor condition: 5.3% (1,828 of 34,497 square meters of bridges)
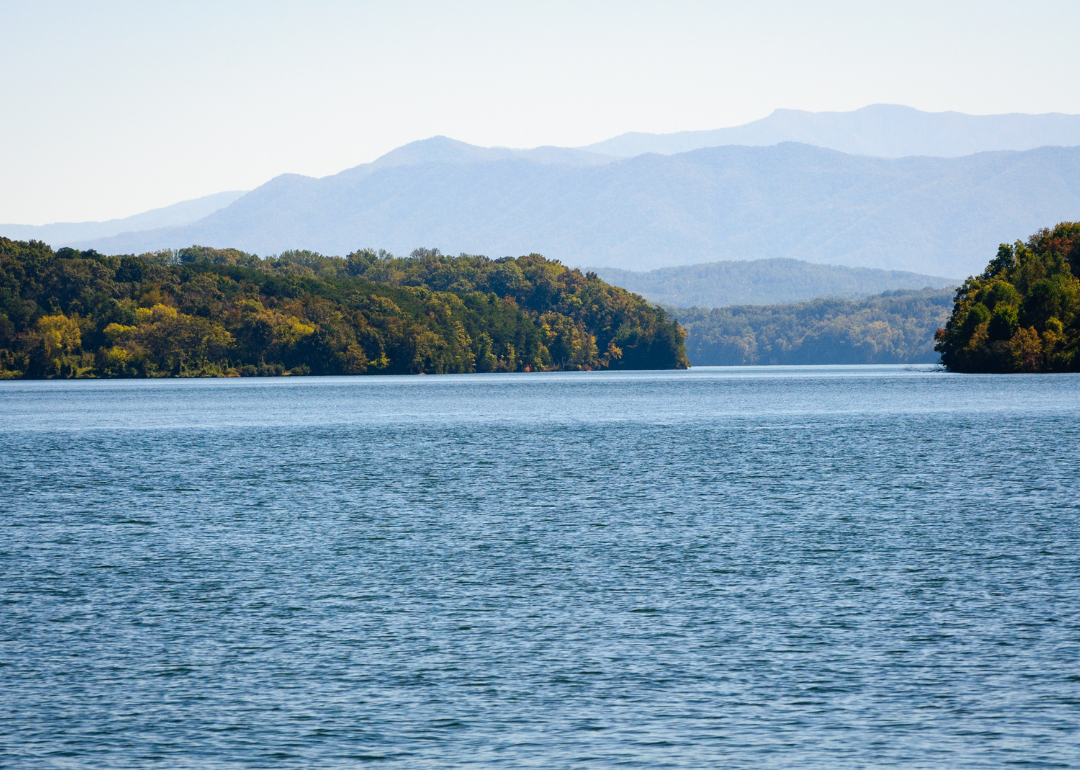
- Bridges in poor condition: 8.3% (12 of 145 bridges)
- Square meters of bridges in poor condition: 15.7% (7,237 of 46,163 square meters of bridges)

- Bridges in poor condition: 8.4% (16 of 190 bridges)
- Square meters of bridges in poor condition: 13.9% (9,323 of 67,025 square meters of bridges)

- Bridges in poor condition: 8.6% (12 of 140 bridges)
- Square meters of bridges in poor condition: 10.1% (5,774 of 56,913 square meters of bridges)

- Bridges in poor condition: 9.5% (18 of 189 bridges)
- Square meters of bridges in poor condition: 8.9% (7,466 of 83,464 square meters of bridges)
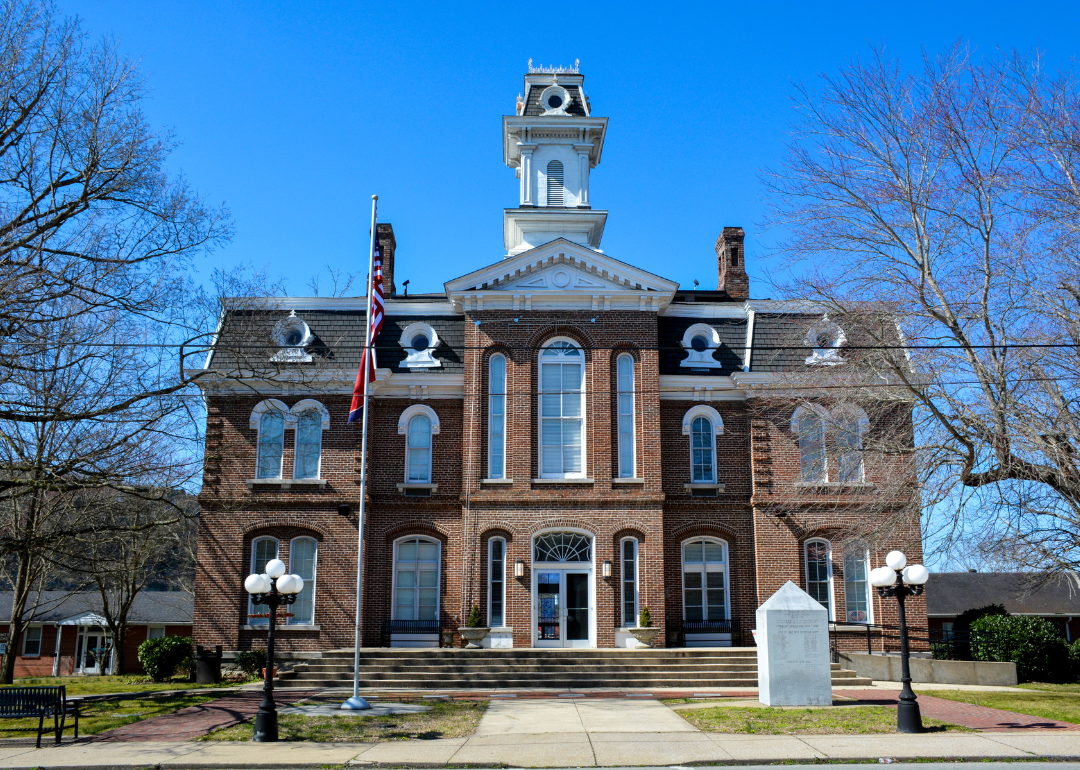
- Bridges in poor condition: 10.9% (22 of 202 bridges)
- Square meters of bridges in poor condition: 19.5% (16,157 of 83,017 square meters of bridges)
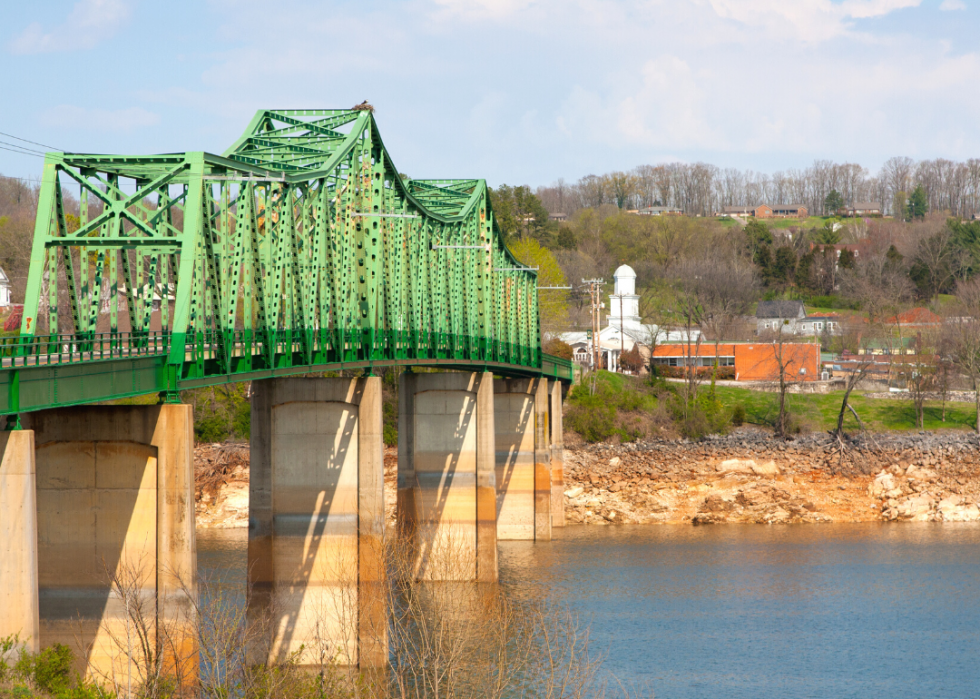
- Bridges in poor condition: 11.5% (14 of 122 bridges)
- Square meters of bridges in poor condition: 5.0% (4,148 of 82,365 square meters of bridges)

- Bridges in poor condition: 11.7% (29 of 247 bridges)
- Square meters of bridges in poor condition: 24.2% (21,613 of 89,463 square meters of bridges)

- Bridges in poor condition: 13.1% (13 of 99 bridges)
- Square meters of bridges in poor condition: 20.4% (8,686 of 42,553 square meters of bridges)
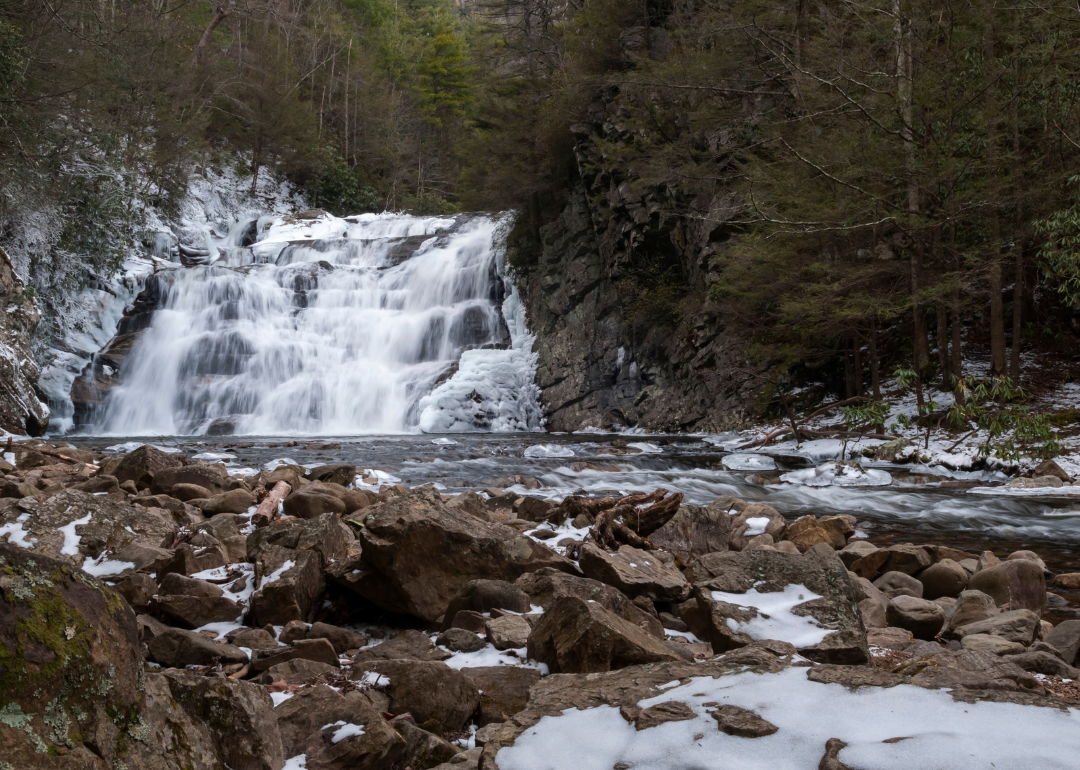
- Bridges in poor condition: 13.8% (27 of 196 bridges)
- Square meters of bridges in poor condition: 3.9% (3,165 of 80,505 square meters of bridges)

- Bridges in poor condition: 14.7% (20 of 136 bridges)
- Square meters of bridges in poor condition: 15.1% (9,646 of 63,838 square meters of bridges)
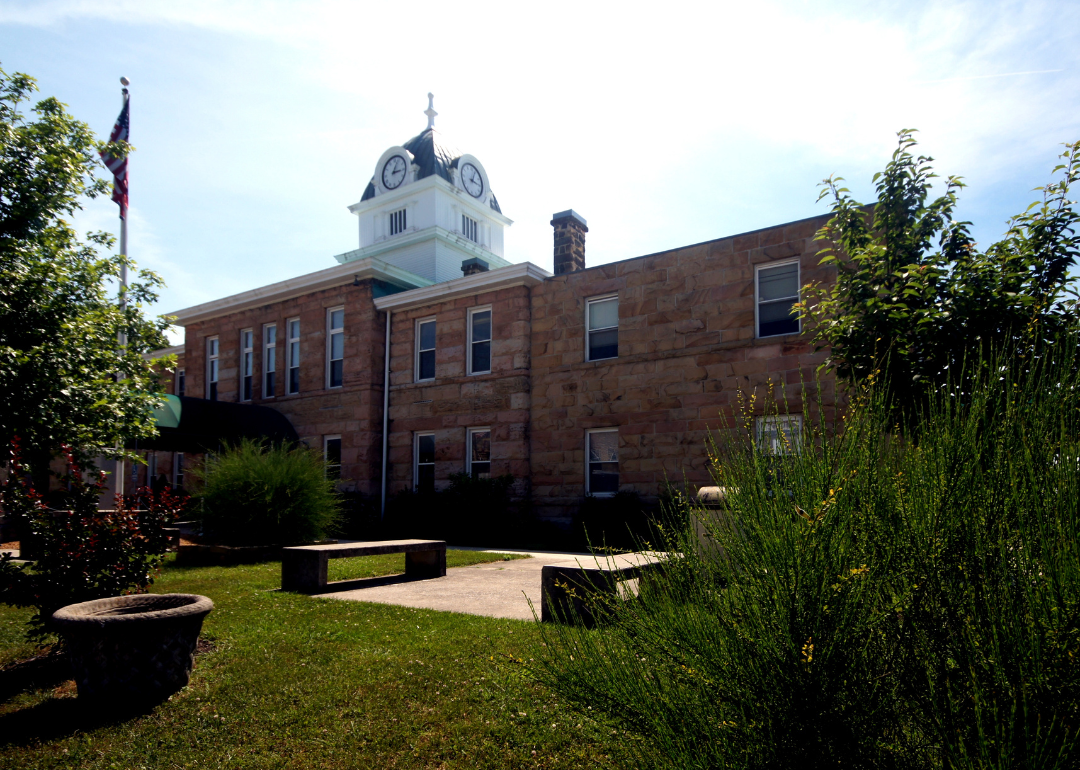
- Bridges in poor condition: 16.1% (9 of 56 bridges)
- Square meters of bridges in poor condition: 17.0% (3,279 of 19,266 square meters of bridges)
