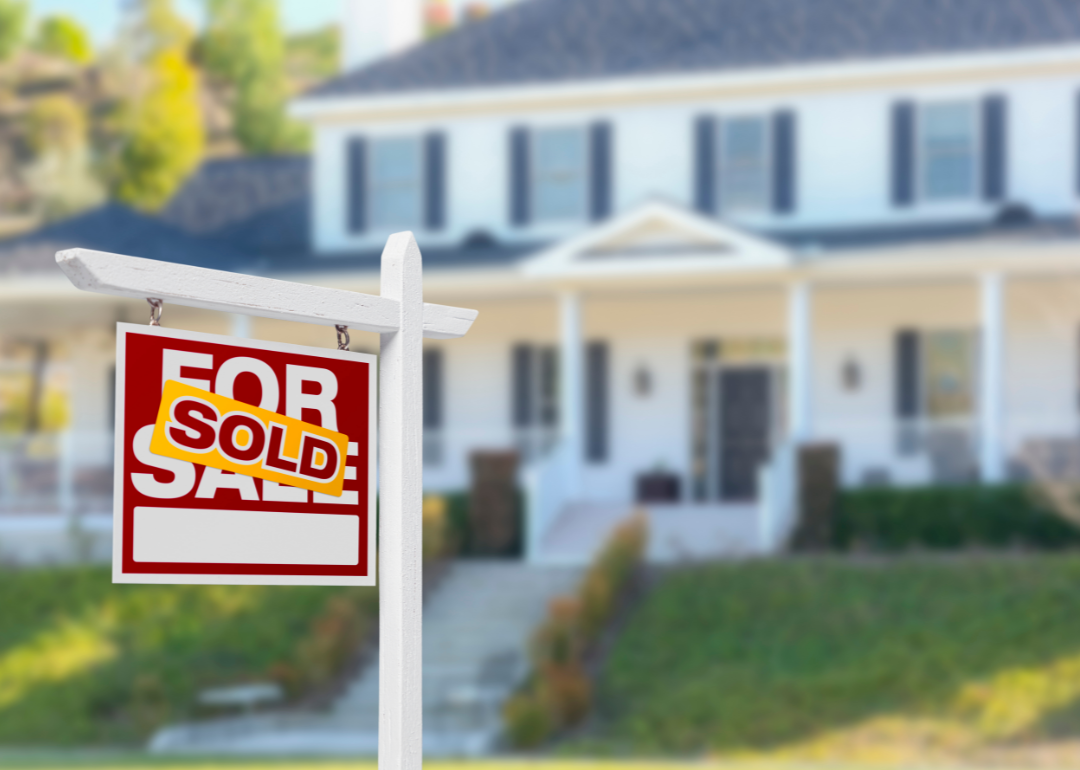
Counties with the most homes selling under list price in Tennessee

- Average price difference: 0.78% below list
-- Median list price: $334,900
-- Median sale price: $323,000
- Total homes sold: 393
-- Share that sold above list: 14.5%

- Average price difference: 0.81% below list
-- Median list price: $459,900
-- Median sale price: $434,900
- Total homes sold: 435
-- Share that sold above list: 16.6%

- Average price difference: 1.20% below list
-- Median list price: $397,900
-- Median sale price: $377,450
- Total homes sold: 654
-- Share that sold above list: 28.0%
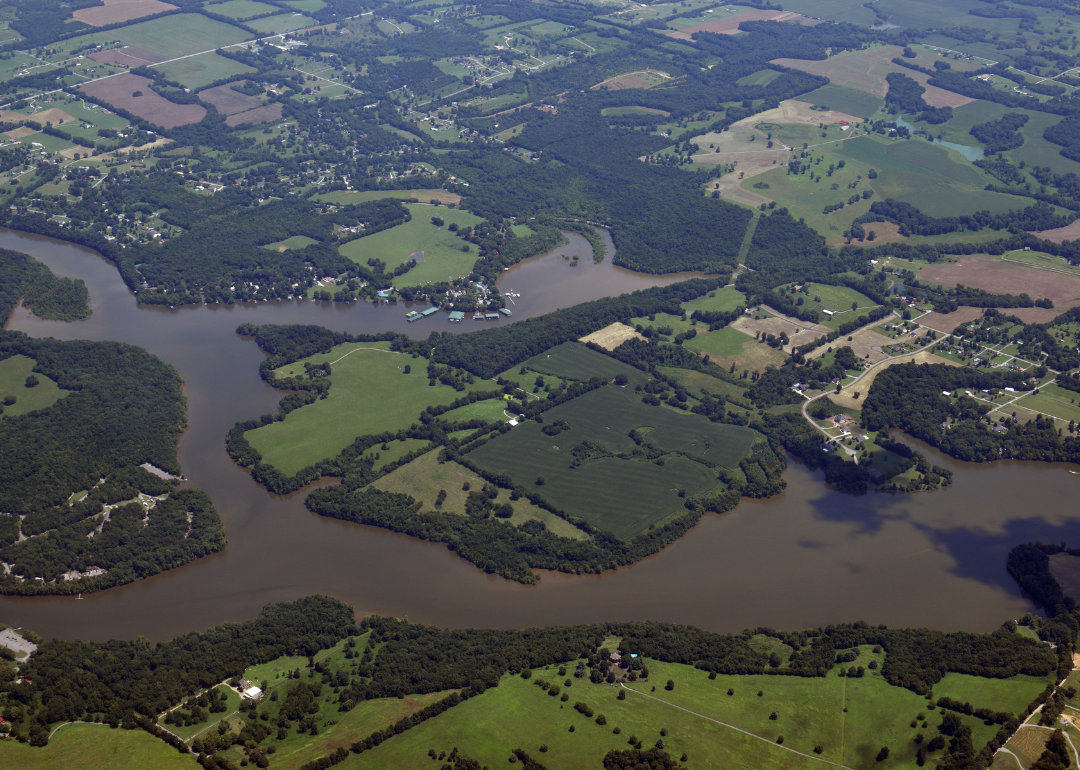
- Average price difference: 1.36% below list
-- Median list price: $451,265
-- Median sale price: $427,500
- Total homes sold: 273
-- Share that sold above list: 20.1%
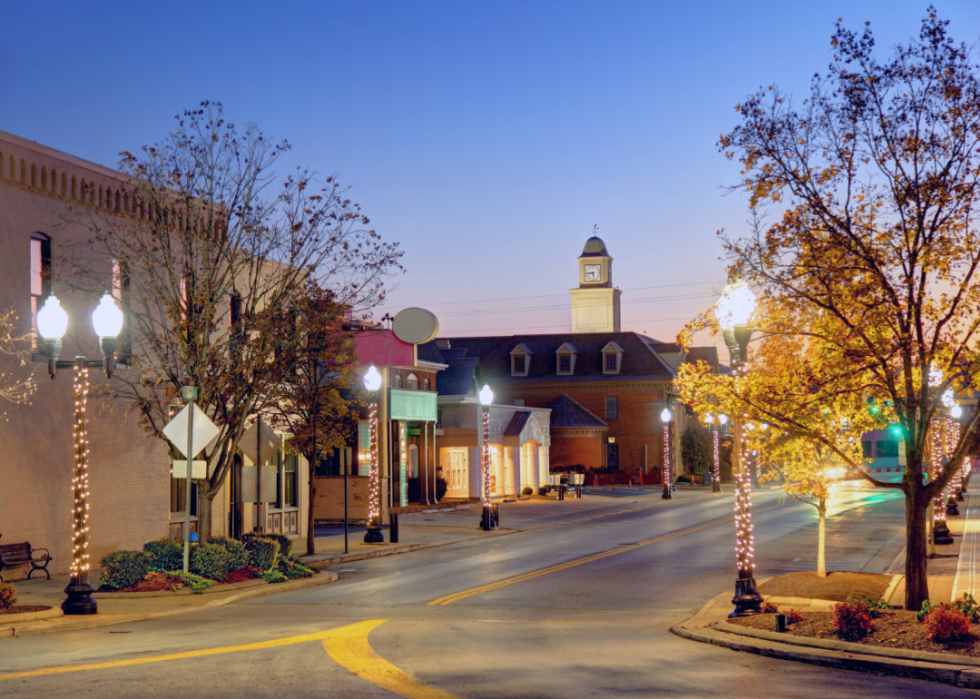
- Average price difference: 1.42% below list
-- Median list price: $972,400
-- Median sale price: $899,900
- Total homes sold: 353
-- Share that sold above list: 16.4%
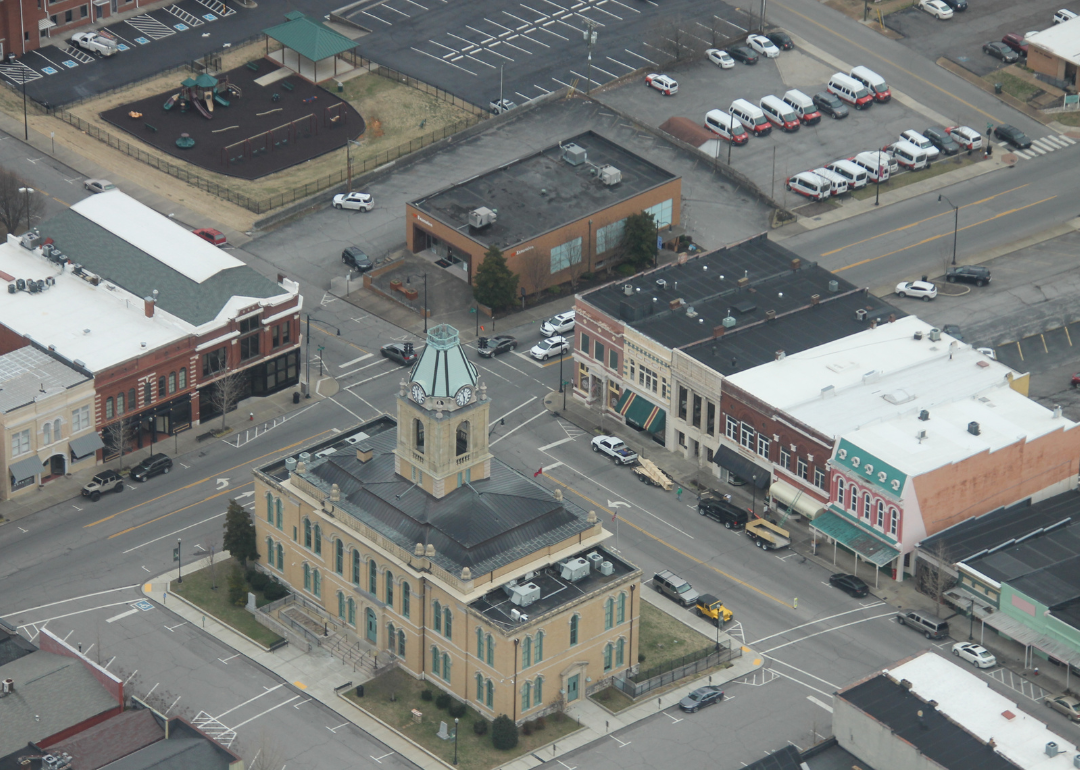
- Average price difference: 1.47% below list
-- Median list price: $369,494
-- Median sale price: $354,492
- Total homes sold: 132
-- Share that sold above list: 20.5%
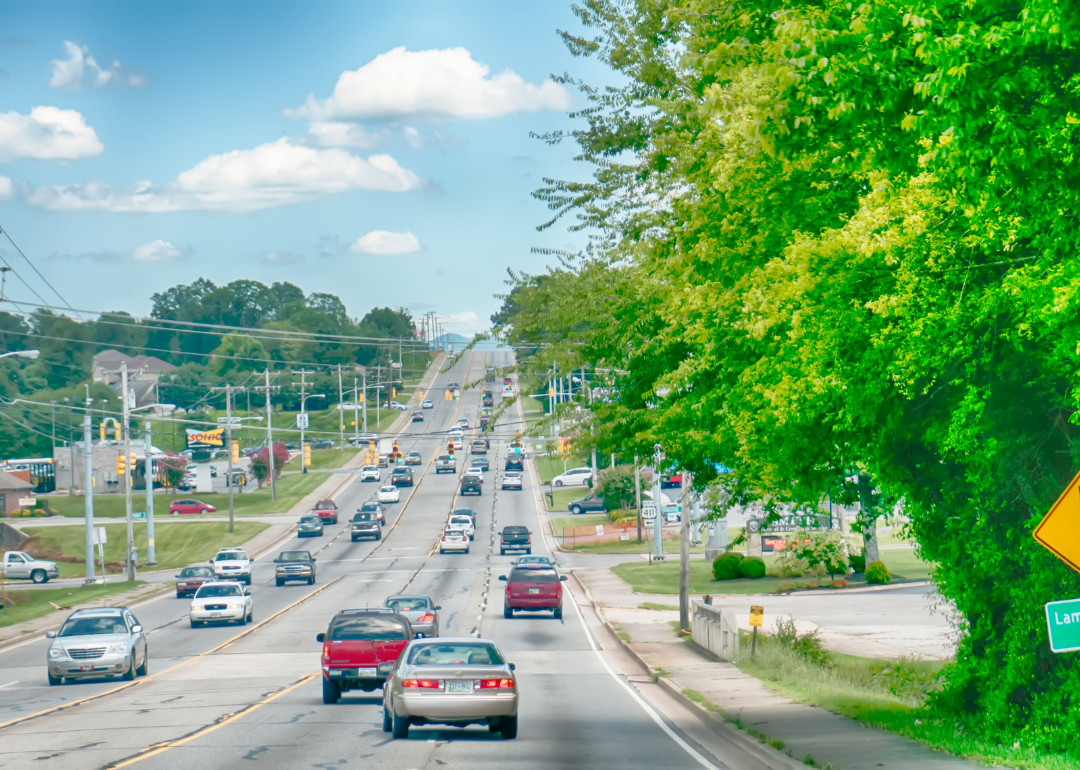
- Average price difference: 1.59% below list
-- Median list price: $419,900
-- Median sale price: $370,000
- Total homes sold: 149
-- Share that sold above list: 26.2%
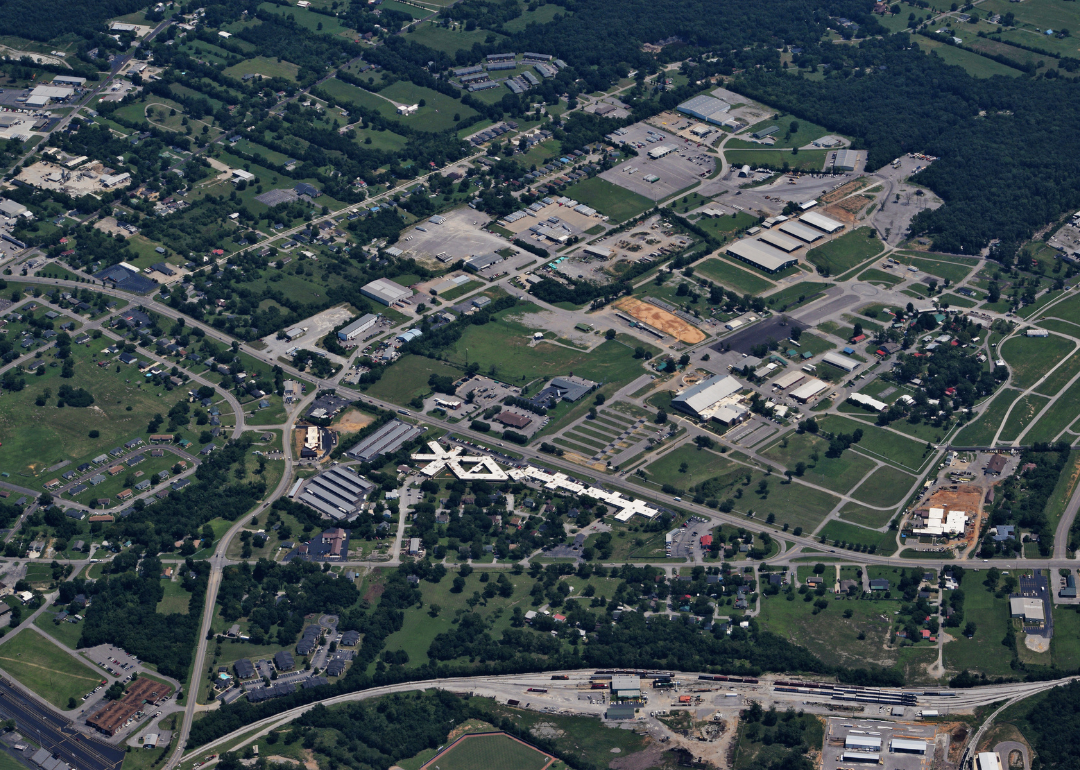
- Average price difference: 1.63% below list
-- Median list price: $469,000
-- Median sale price: $445,000
- Total homes sold: 246
-- Share that sold above list: 13.8%
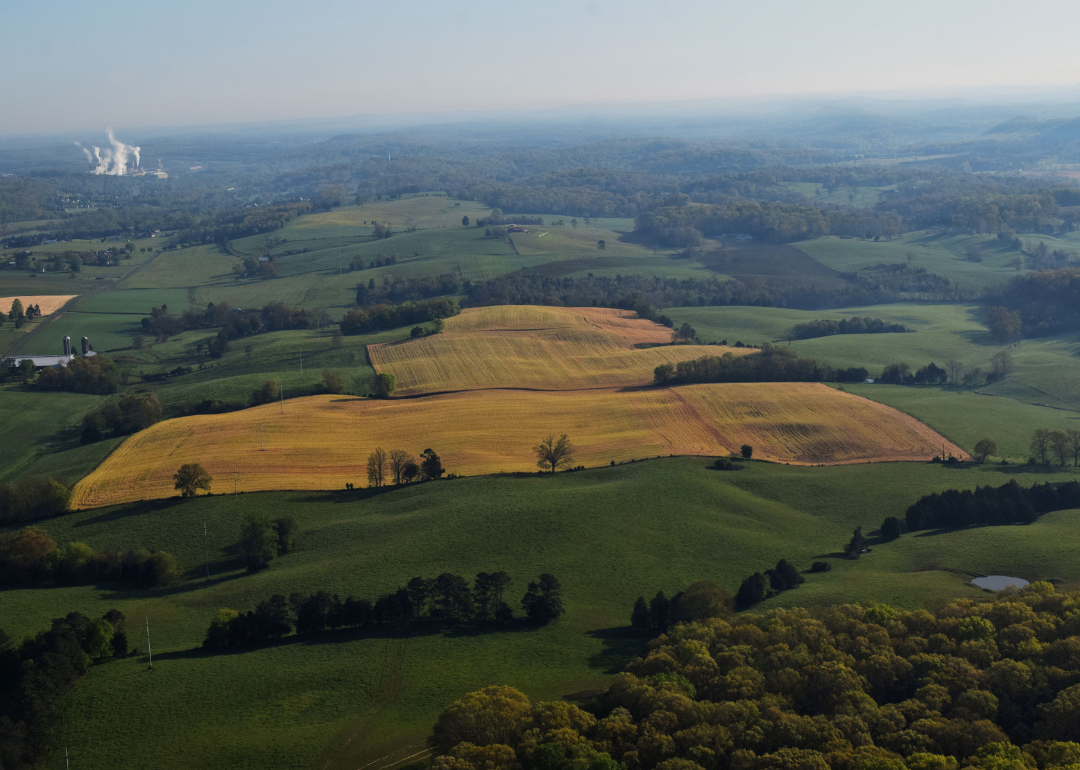
- Average price difference: 1.91% below list
-- Median list price: $352,404
-- Median sale price: $297,450
- Total homes sold: 120
-- Share that sold above list: 23.3%

- Average price difference: 1.93% below list
-- Median list price: $524,990
-- Median sale price: $479,450
- Total homes sold: 944
-- Share that sold above list: 15.0%
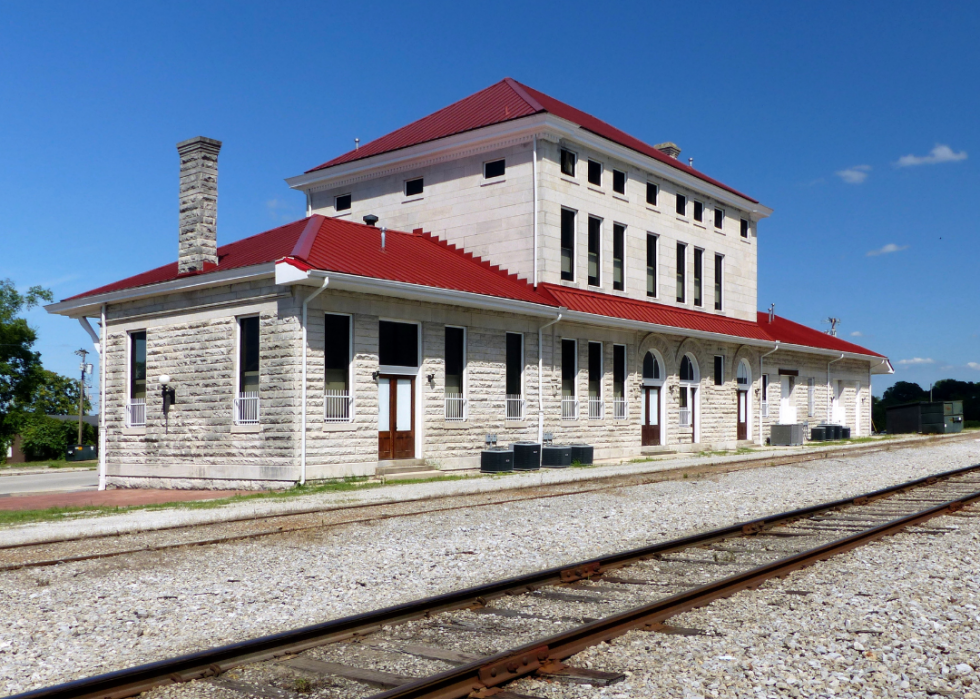
- Average price difference: 1.96% below list
-- Median list price: $455,000
-- Median sale price: $419,900
- Total homes sold: 175
-- Share that sold above list: 18.3%

- Average price difference: 2.12% below list
-- Median list price: $350,000
-- Median sale price: $305,000
- Total homes sold: 149
-- Share that sold above list: 24.2%

- Average price difference: 2.55% below list
-- Median list price: $307,000
-- Median sale price: $282,000
- Total homes sold: 189
-- Share that sold above list: 22.2%
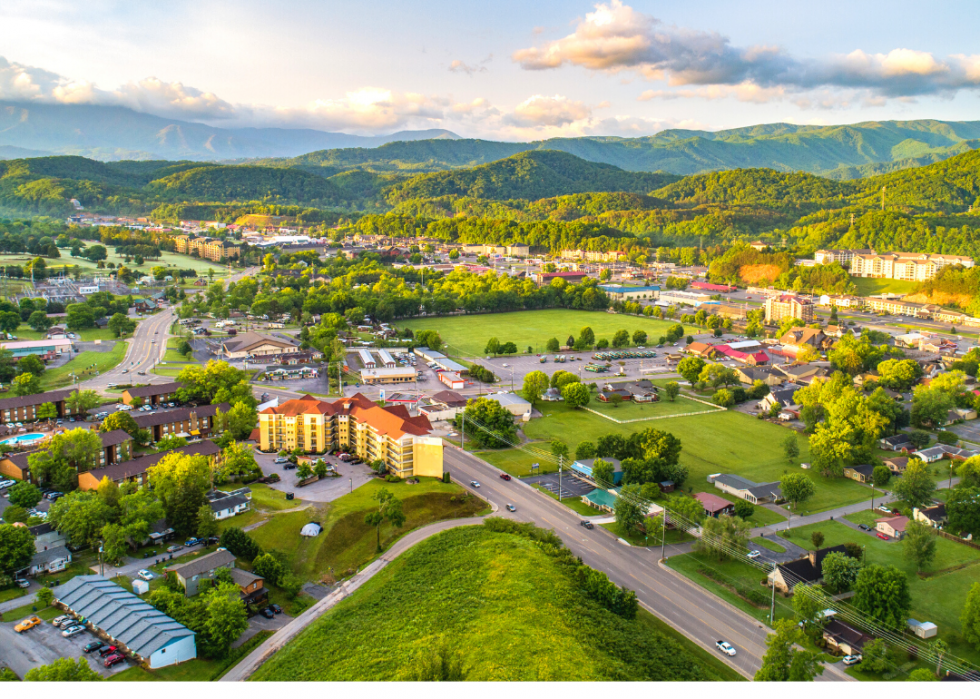
- Average price difference: 3.22% below list
-- Median list price: $649,900
-- Median sale price: $462,750
- Total homes sold: 168
-- Share that sold above list: 9.5%

- Average price difference: 3.23% below list
-- Median list price: $275,000
-- Median sale price: $254,700
- Total homes sold: 781
-- Share that sold above list: 20.7%
This story features data reporting and writing by Elena Cox and is part of a series utilizing data automation across 28 states.
