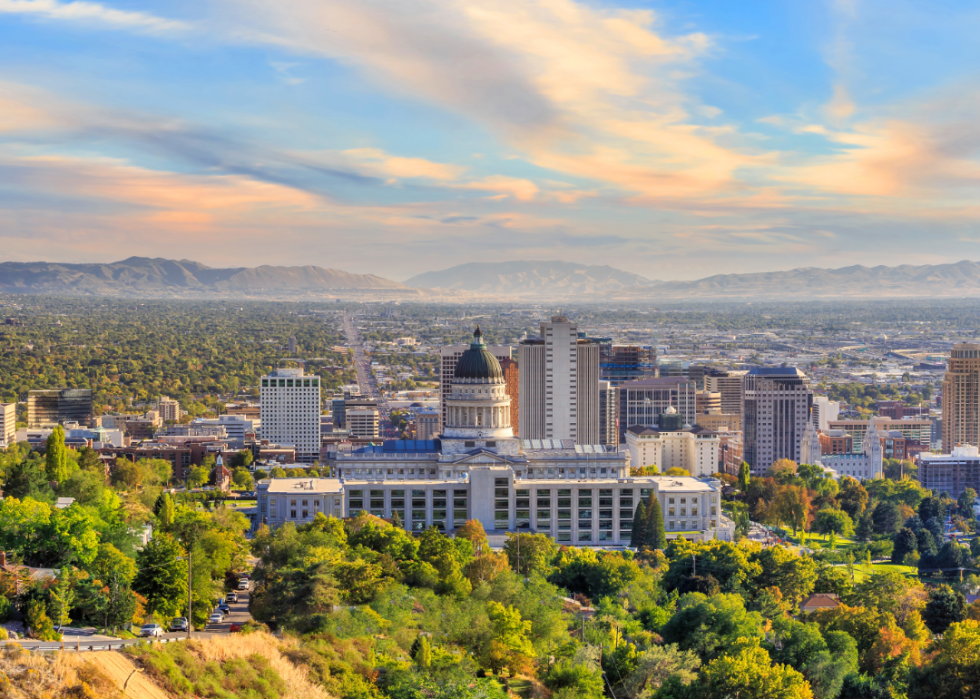
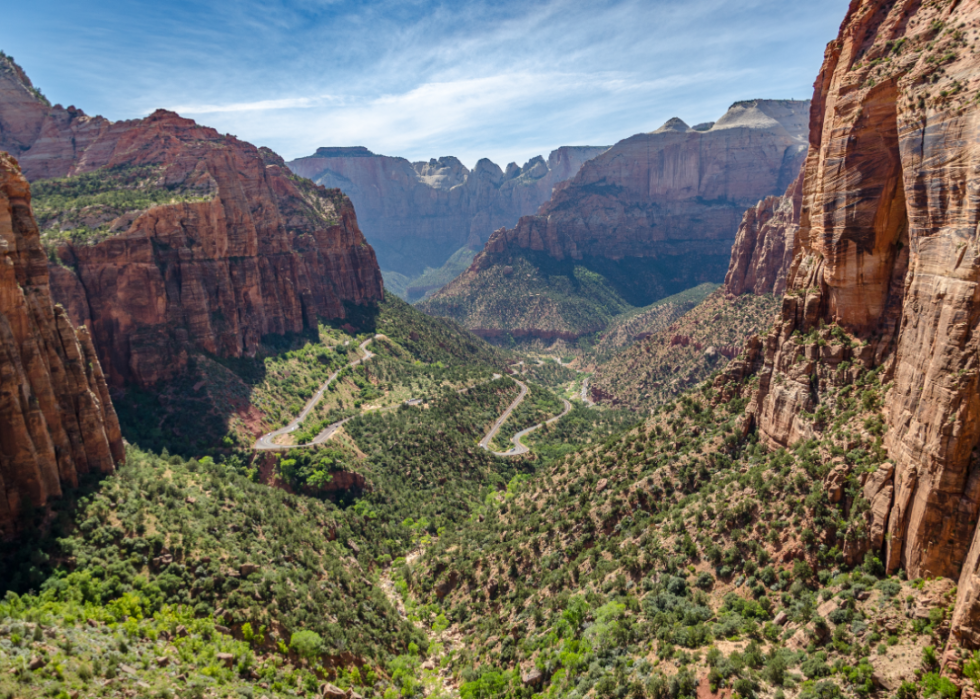
Counties with the highest rates of strokes in Utah
Canva
- Age-adjusted rate of all strokes among adults, estimates for 2021: 2.1% (range between 1.9% and 2.5%)
- Death rate for ischemic strokes, 2018-20: 18.4 per 100K people
- Death rate for hemorrhagic strokes, 2018-20: 6.7 per 100K people
- Death rate for ischemic strokes, 2018-20: 18.4 per 100K people
- Death rate for hemorrhagic strokes, 2018-20: 6.7 per 100K people
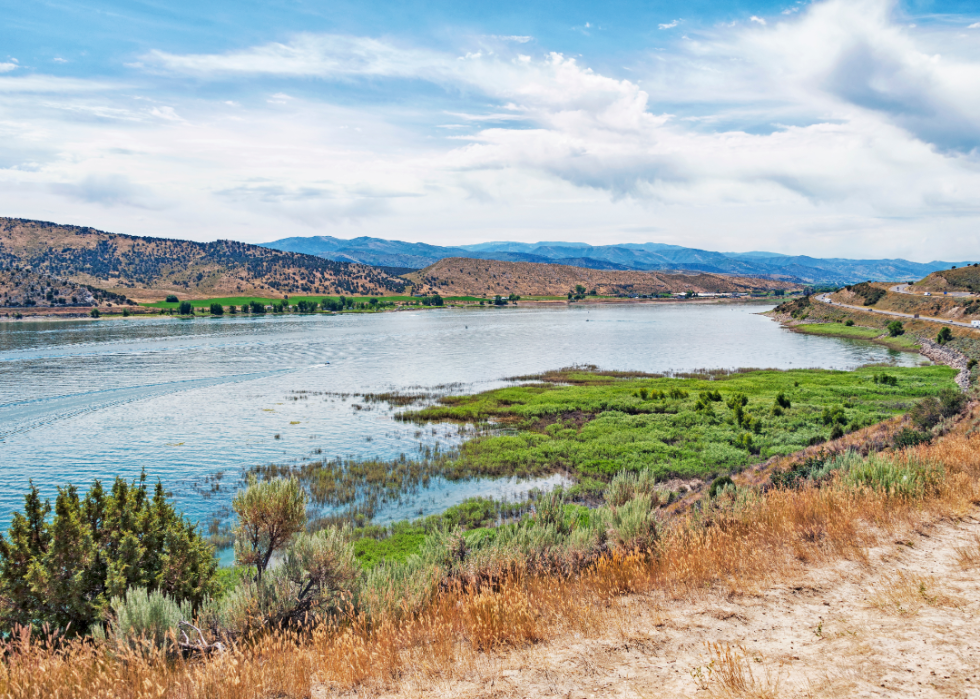
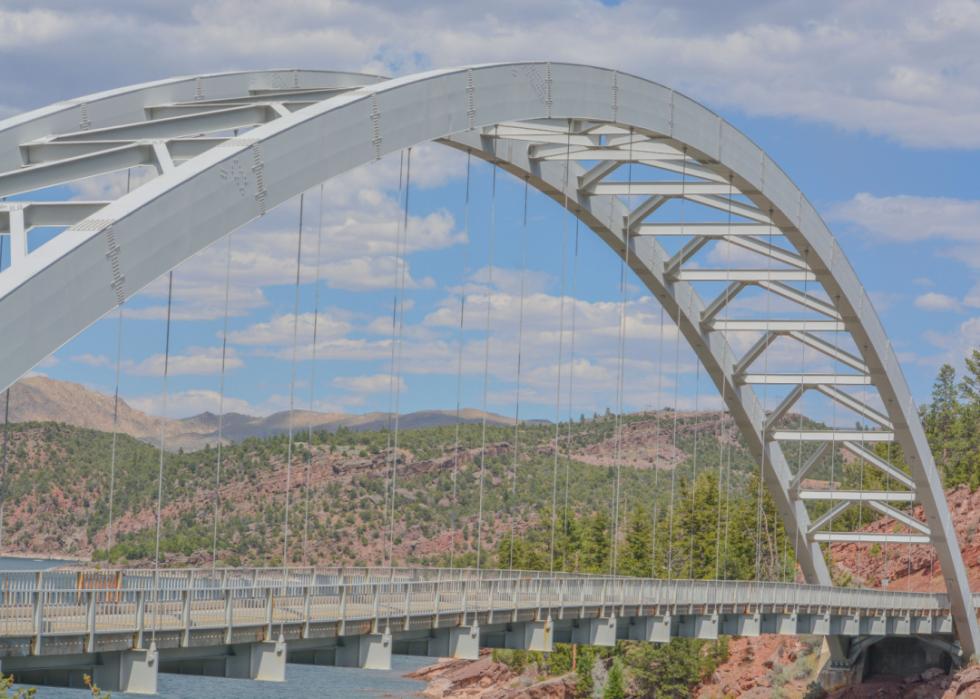
#29. Summit County
Canva
- Age-adjusted rate of all strokes among adults, estimates for 2021: 2.2% (range between 1.9% and 2.5%)
- Death rate for ischemic strokes, 2018-20: 19.0 per 100K people
- Death rate for hemorrhagic strokes, 2018-20: 7.0 per 100K people
- Death rate for ischemic strokes, 2018-20: 19.0 per 100K people
- Death rate for hemorrhagic strokes, 2018-20: 7.0 per 100K people
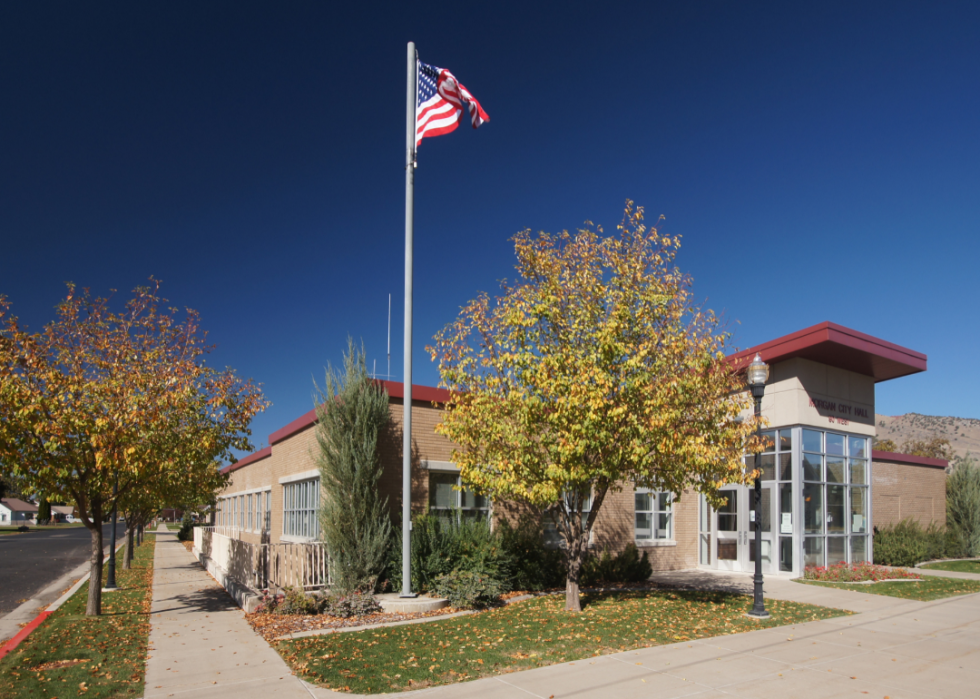
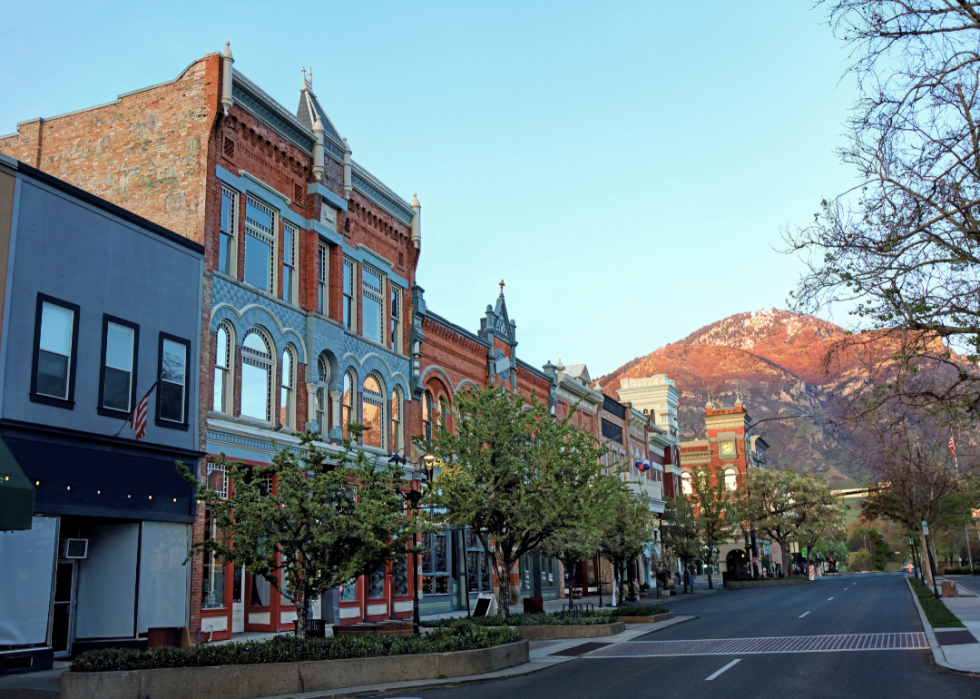
#28. Morgan County
NicholasGeraldinePhotos // Shutterstock
- Age-adjusted rate of all strokes among adults, estimates for 2021: 2.3% (range between 2.1% and 2.6%)
- Death rate for ischemic strokes, 2018-20: 19.0 per 100K people
- Death rate for hemorrhagic strokes, 2018-20: 6.9 per 100K people
- Death rate for ischemic strokes, 2018-20: 19.0 per 100K people
- Death rate for hemorrhagic strokes, 2018-20: 6.9 per 100K people
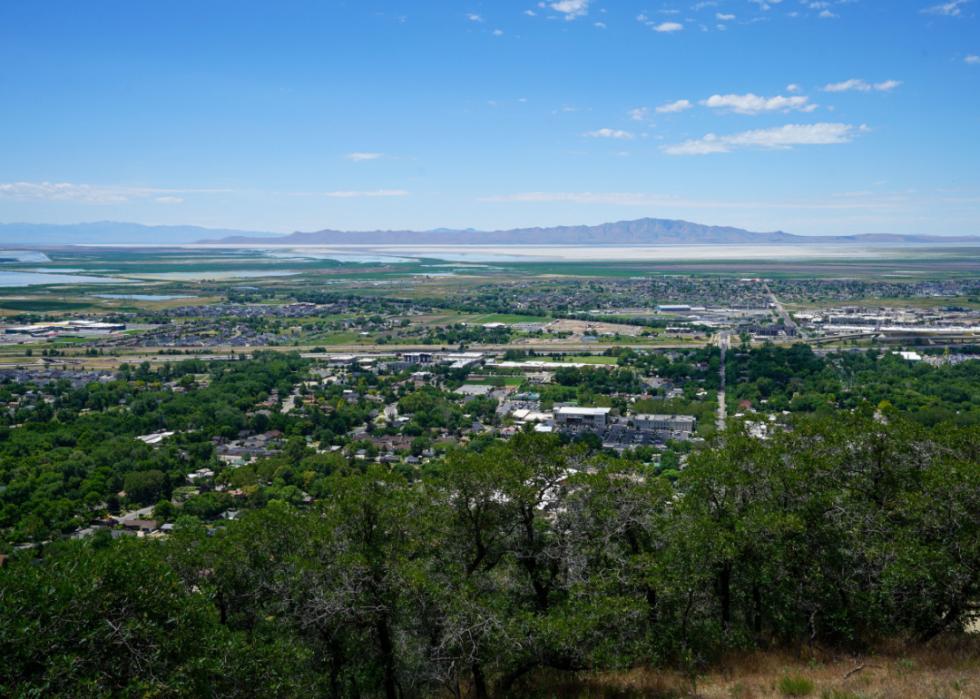
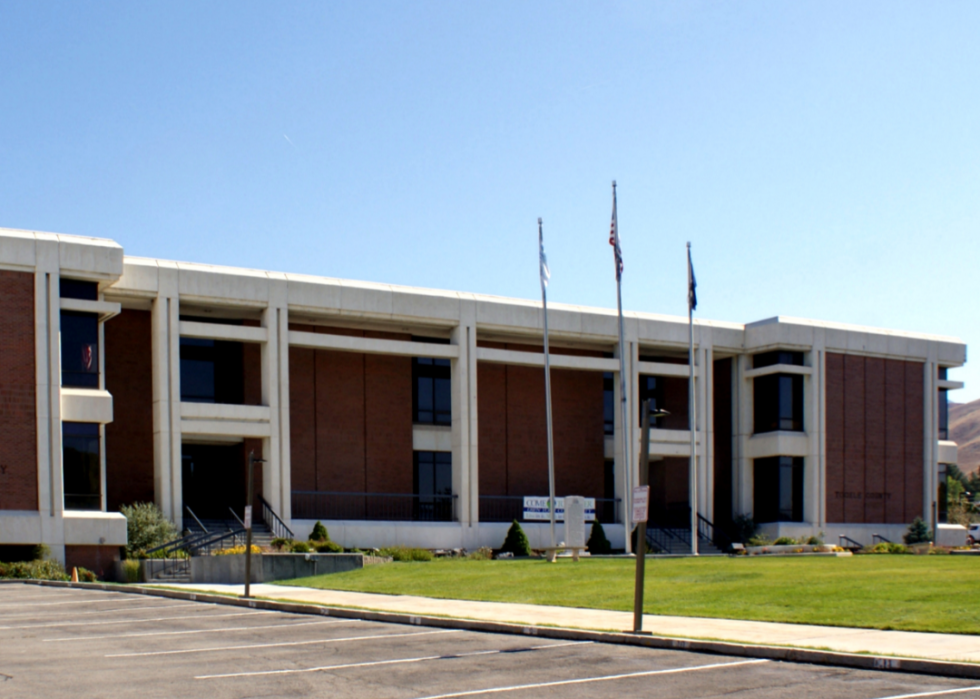
#27. Davis County
Canva
- Age-adjusted rate of all strokes among adults, estimates for 2021: 2.3% (range between 2.0% and 2.6%)
- Death rate for ischemic strokes, 2018-20: 19.2 per 100K people
- Death rate for hemorrhagic strokes, 2018-20: 6.8 per 100K people
- Death rate for ischemic strokes, 2018-20: 19.2 per 100K people
- Death rate for hemorrhagic strokes, 2018-20: 6.8 per 100K people
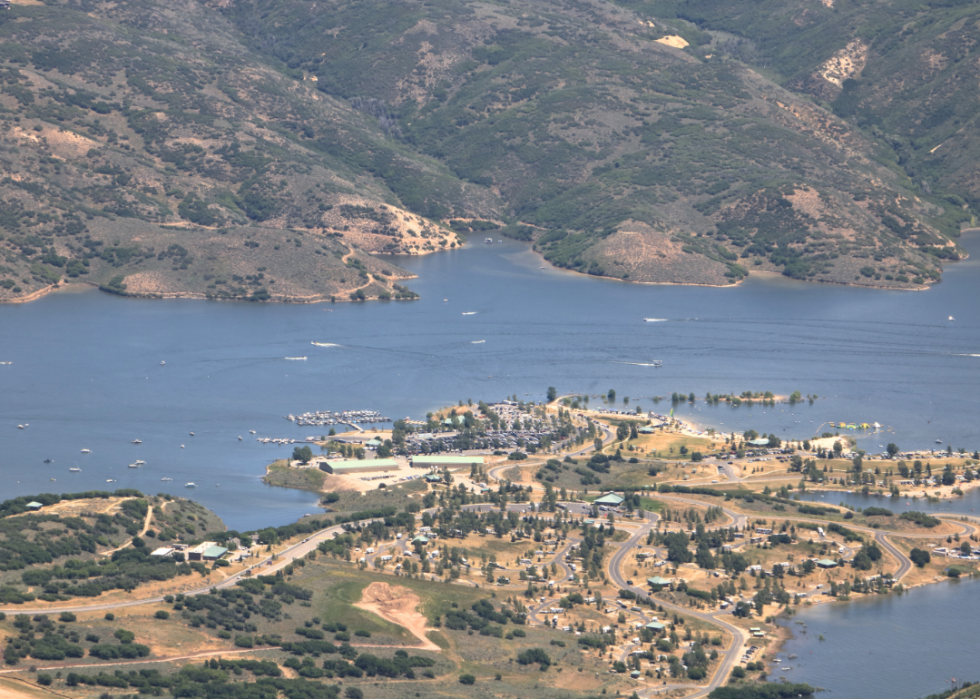
#26. Wasatch County
Canva
- Age-adjusted rate of all strokes among adults, estimates for 2021: 2.4% (range between 2.1% and 2.8%)
- Death rate for ischemic strokes, 2018-20: 18.8 per 100K people
- Death rate for hemorrhagic strokes, 2018-20: 6.8 per 100K people
- Death rate for ischemic strokes, 2018-20: 18.8 per 100K people
- Death rate for hemorrhagic strokes, 2018-20: 6.8 per 100K people
You may also like: Counties with the worst commutes in Utah
#25. Salt Lake County
Norm Lane // Shutterstock
- Age-adjusted rate of all strokes among adults, estimates for 2021: 2.5% (range between 2.2% and 2.9%)
- Death rate for ischemic strokes, 2018-20: 19.5 per 100K people
- Death rate for hemorrhagic strokes, 2018-20: 5.1 per 100K people
- Death rate for ischemic strokes, 2018-20: 19.5 per 100K people
- Death rate for hemorrhagic strokes, 2018-20: 5.1 per 100K people
#24. Daggett County
Canva
- Age-adjusted rate of all strokes among adults, estimates for 2021: 2.5% (range between 2.2% and 2.8%)
- Death rate for ischemic strokes, 2018-20: 23.0 per 100K people
- Death rate for hemorrhagic strokes, 2018-20: 6.7 per 100K people
- Death rate for ischemic strokes, 2018-20: 23.0 per 100K people
- Death rate for hemorrhagic strokes, 2018-20: 6.7 per 100K people
#23. Utah County
Canva
- Age-adjusted rate of all strokes among adults, estimates for 2021: 2.6% (range between 2.3% and 2.9%)
- Death rate for ischemic strokes, 2018-20: 18.6 per 100K people
- Death rate for hemorrhagic strokes, 2018-20: 7.0 per 100K people
- Death rate for ischemic strokes, 2018-20: 18.6 per 100K people
- Death rate for hemorrhagic strokes, 2018-20: 7.0 per 100K people
#22. Tooele County
Canva
- Age-adjusted rate of all strokes among adults, estimates for 2021: 2.6% (range between 2.3% and 2.9%)
- Death rate for ischemic strokes, 2018-20: 18.8 per 100K people
- Death rate for hemorrhagic strokes, 2018-20: 7.3 per 100K people
- Death rate for ischemic strokes, 2018-20: 18.8 per 100K people
- Death rate for hemorrhagic strokes, 2018-20: 7.3 per 100K people
#21. Washington County
Canva
- Age-adjusted rate of all strokes among adults, estimates for 2021: 2.6% (range between 2.3% and 3.0%)
- Death rate for ischemic strokes, 2018-20: 19.2 per 100K people
- Death rate for hemorrhagic strokes, 2018-20: 6.3 per 100K people
- Death rate for ischemic strokes, 2018-20: 19.2 per 100K people
- Death rate for hemorrhagic strokes, 2018-20: 6.3 per 100K people
You may also like: Highest-rated golf courses in Utah, according to Tripadvisor
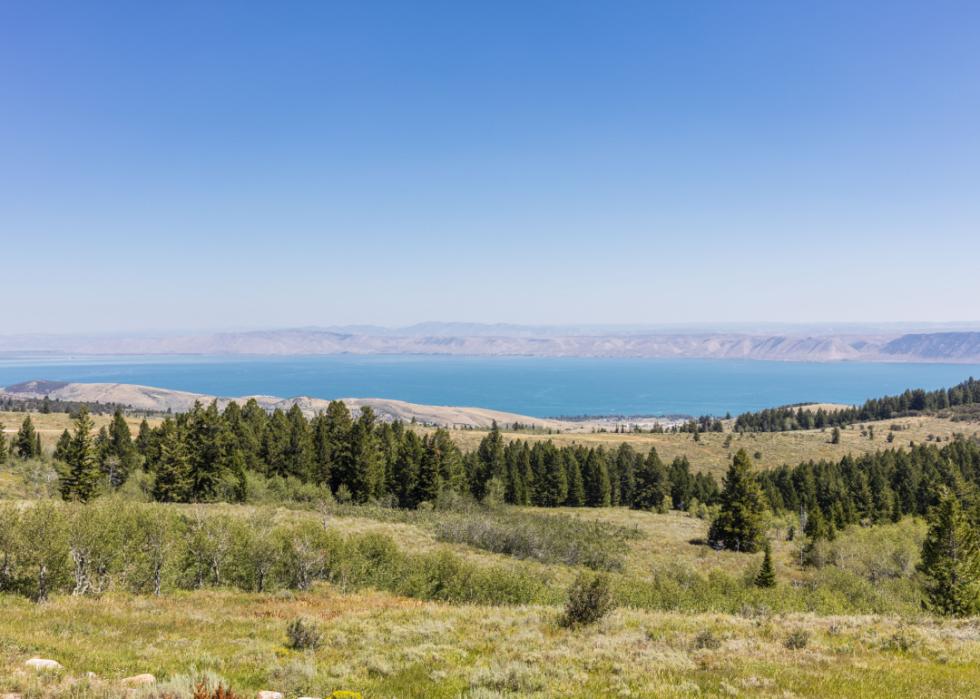
#20. Rich County
Canva
- Age-adjusted rate of all strokes among adults, estimates for 2021: 2.6% (range between 2.3% and 2.9%)
- Death rate for ischemic strokes, 2018-20: 19.9 per 100K people
- Death rate for hemorrhagic strokes, 2018-20: 6.8 per 100K people
- Death rate for ischemic strokes, 2018-20: 19.9 per 100K people
- Death rate for hemorrhagic strokes, 2018-20: 6.8 per 100K people
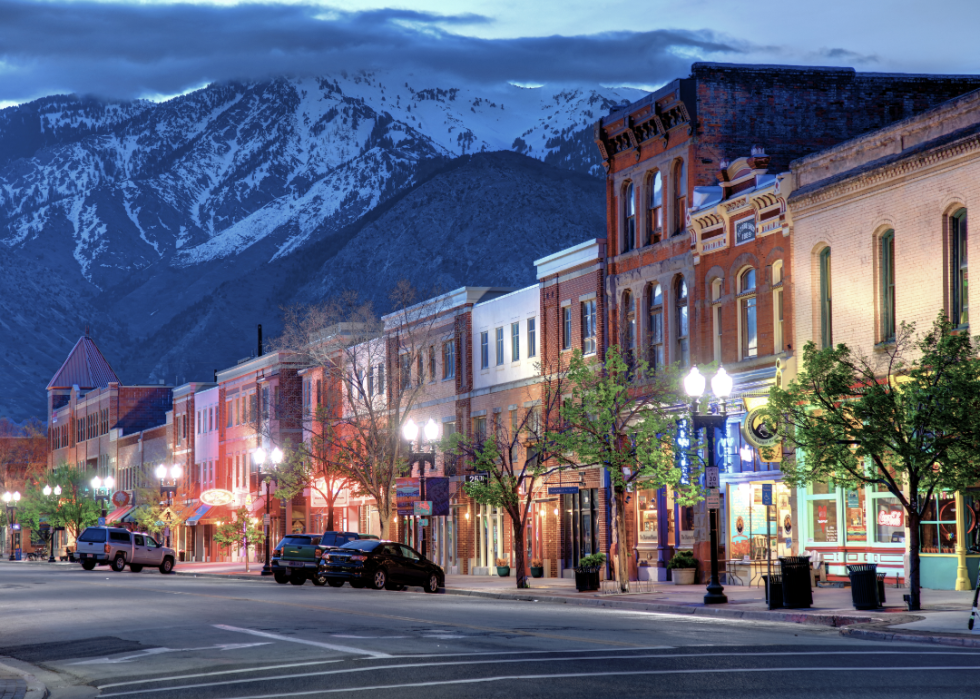
#19. Weber County
Canva
- Age-adjusted rate of all strokes among adults, estimates for 2021: 2.6% (range between 2.3% and 3.0%)
- Death rate for ischemic strokes, 2018-20: 20.4 per 100K people
- Death rate for hemorrhagic strokes, 2018-20: 7.6 per 100K people
- Death rate for ischemic strokes, 2018-20: 20.4 per 100K people
- Death rate for hemorrhagic strokes, 2018-20: 7.6 per 100K people
#18. Box Elder County
Canva
- Age-adjusted rate of all strokes among adults, estimates for 2021: 2.6% (range between 2.3% and 3.0%)
- Death rate for ischemic strokes, 2018-20: 24.1 per 100K people
- Death rate for hemorrhagic strokes, 2018-20: 7.5 per 100K people
- Death rate for ischemic strokes, 2018-20: 24.1 per 100K people
- Death rate for hemorrhagic strokes, 2018-20: 7.5 per 100K people
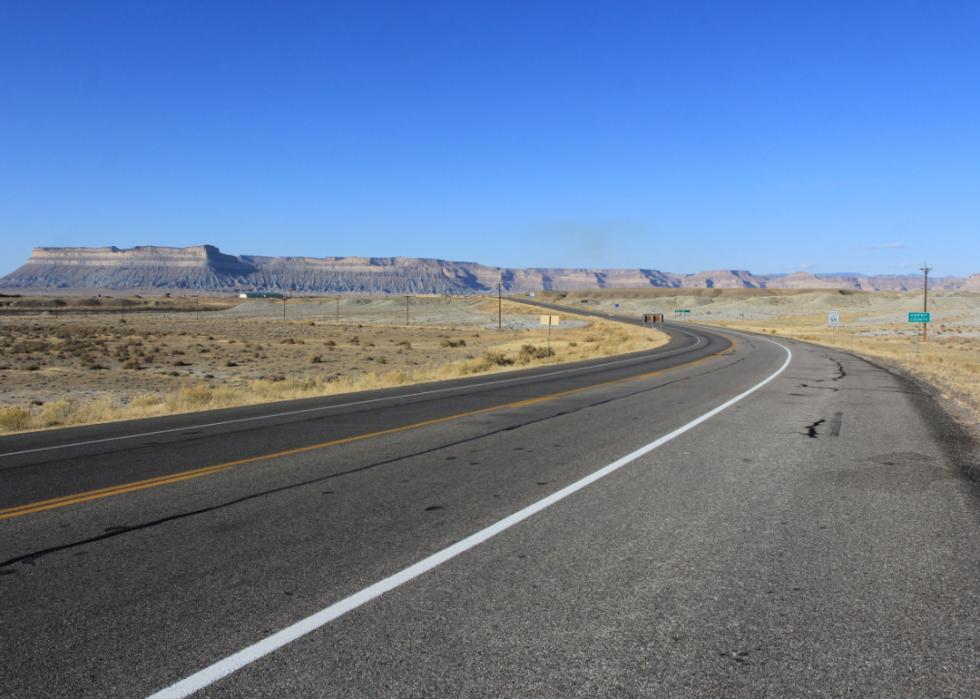
#17. Beaver County
Canva
- Age-adjusted rate of all strokes among adults, estimates for 2021: 2.7% (range between 2.3% and 3.1%)
- Death rate for ischemic strokes, 2018-20: 17.7 per 100K people
- Death rate for hemorrhagic strokes, 2018-20: 7.1 per 100K people
- Death rate for ischemic strokes, 2018-20: 17.7 per 100K people
- Death rate for hemorrhagic strokes, 2018-20: 7.1 per 100K people
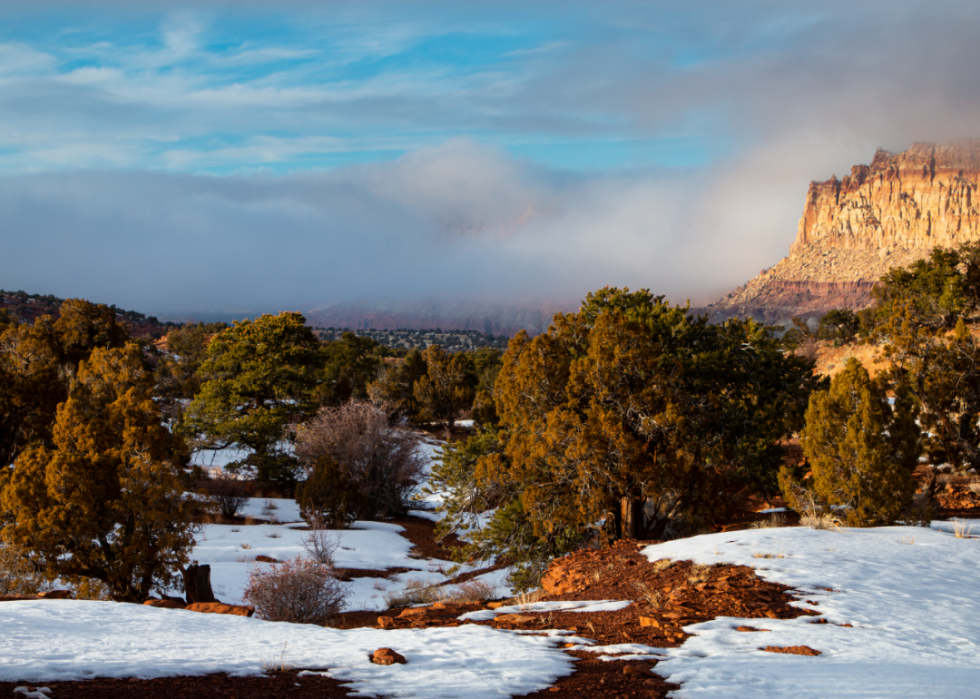
#16. Kane County
Canva
- Age-adjusted rate of all strokes among adults, estimates for 2021: 2.7% (range between 2.4% and 3.1%)
- Death rate for ischemic strokes, 2018-20: 20.6 per 100K people
- Death rate for hemorrhagic strokes, 2018-20: 6.9 per 100K people
- Death rate for ischemic strokes, 2018-20: 20.6 per 100K people
- Death rate for hemorrhagic strokes, 2018-20: 6.9 per 100K people
You may also like: Highest rated beer in Utah
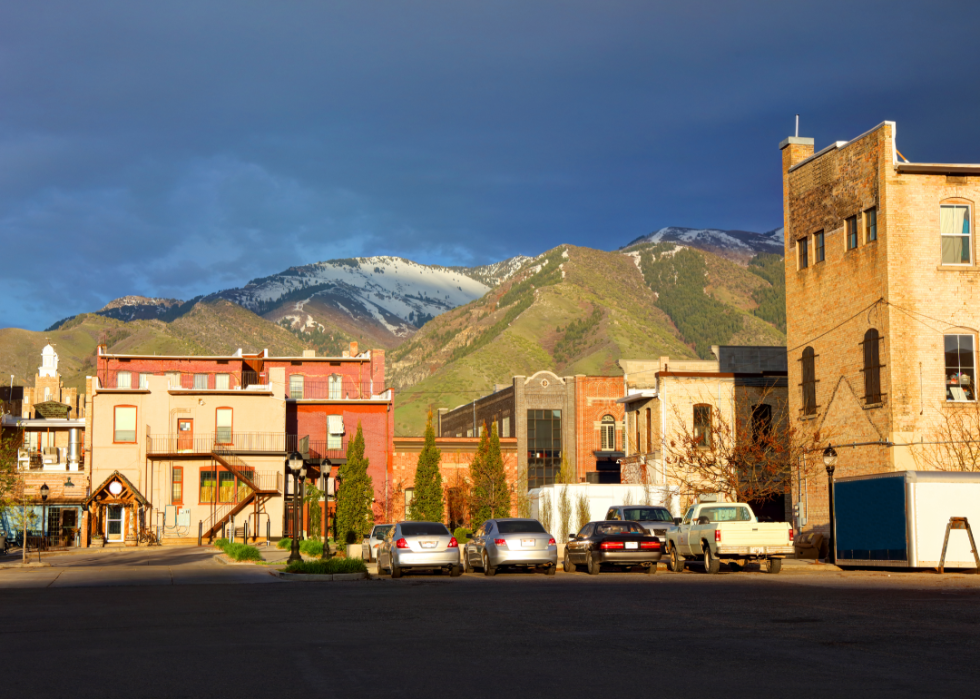
#15. Cache County
Comg // Shutterstock
- Age-adjusted rate of all strokes among adults, estimates for 2021: 2.7% (range between 2.4% and 3.1%)
- Death rate for ischemic strokes, 2018-20: 21.6 per 100K people
- Death rate for hemorrhagic strokes, 2018-20: 6.4 per 100K people
- Death rate for ischemic strokes, 2018-20: 21.6 per 100K people
- Death rate for hemorrhagic strokes, 2018-20: 6.4 per 100K people
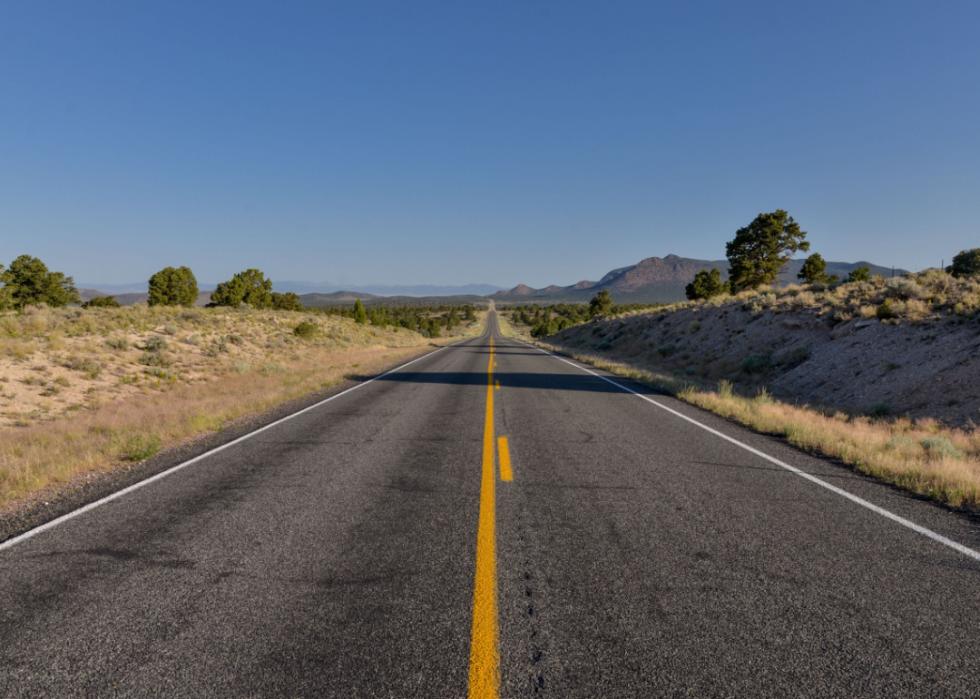
#14. Juab County
Canva
- Age-adjusted rate of all strokes among adults, estimates for 2021: 2.8% (range between 2.5% and 3.2%)
- Death rate for ischemic strokes, 2018-20: 14.8 per 100K people
- Death rate for hemorrhagic strokes, 2018-20: 6.9 per 100K people
- Death rate for ischemic strokes, 2018-20: 14.8 per 100K people
- Death rate for hemorrhagic strokes, 2018-20: 6.9 per 100K people
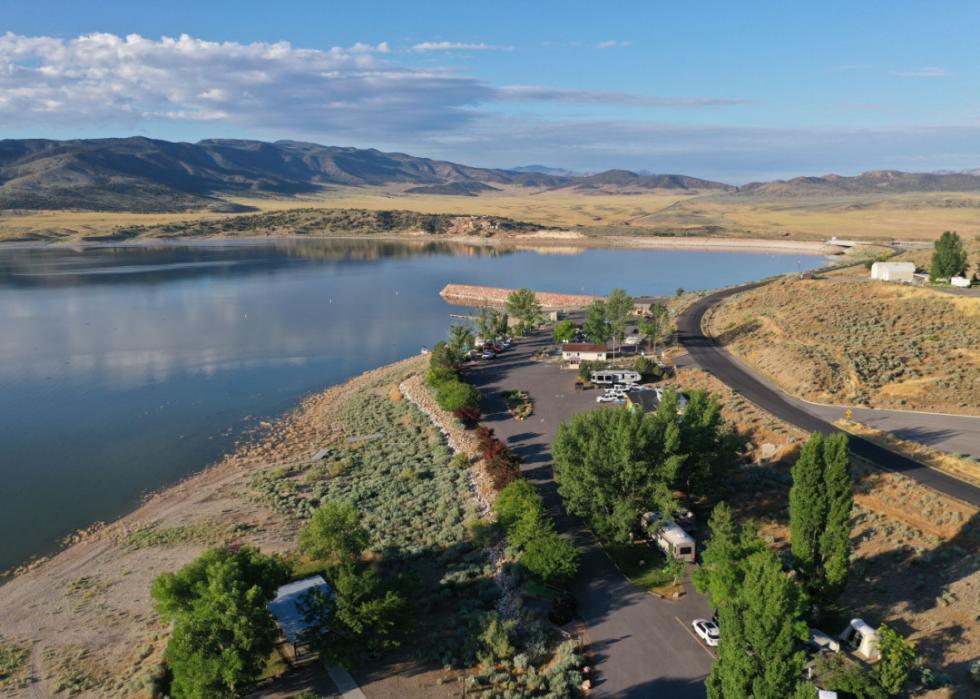
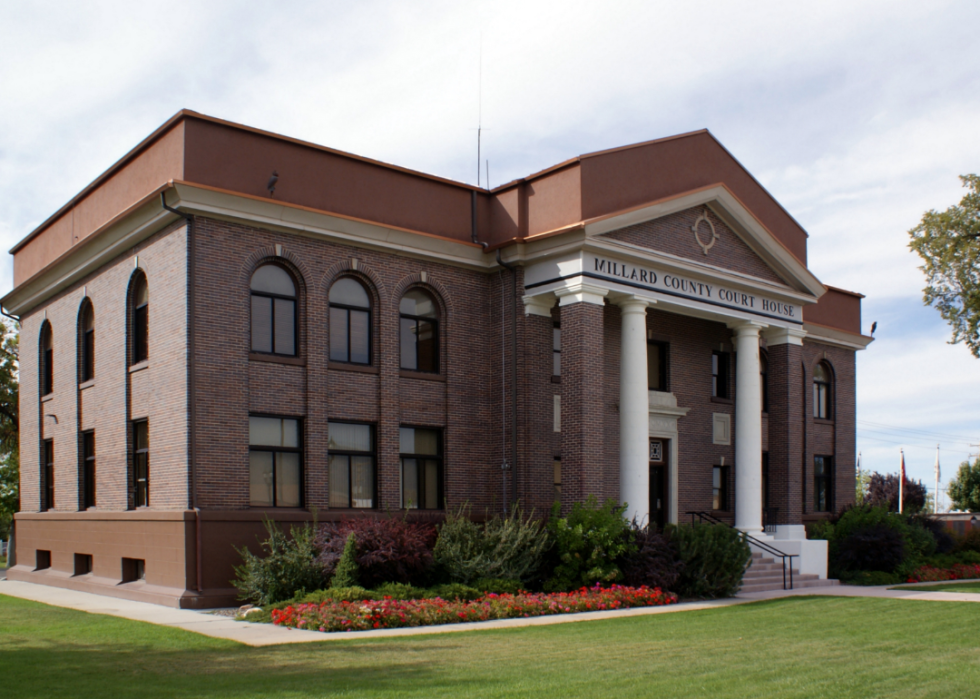
#13. Millard County

Canva
- Age-adjusted rate of all strokes among adults, estimates for 2021: 2.8% (range between 2.4% and 3.2%)
- Death rate for ischemic strokes, 2018-20: 17.6 per 100K people
- Death rate for hemorrhagic strokes, 2018-20: 6.2 per 100K people
- Death rate for ischemic strokes, 2018-20: 17.6 per 100K people
- Death rate for hemorrhagic strokes, 2018-20: 6.2 per 100K people
#12. Grand County
Chris Curtis // Shutterstock
- Age-adjusted rate of all strokes among adults, estimates for 2021: 2.8% (range between 2.4% and 3.2%)
- Death rate for ischemic strokes, 2018-20: 21.1 per 100K people
- Death rate for hemorrhagic strokes, 2018-20: 6.5 per 100K people
- Death rate for ischemic strokes, 2018-20: 21.1 per 100K people
- Death rate for hemorrhagic strokes, 2018-20: 6.5 per 100K people
#11. Sevier County
Canva
- Age-adjusted rate of all strokes among adults, estimates for 2021: 2.8% (range between 2.4% and 3.1%)
- Death rate for ischemic strokes, 2018-20: 22.3 per 100K people
- Death rate for hemorrhagic strokes, 2018-20: 7.8 per 100K people
- Death rate for ischemic strokes, 2018-20: 22.3 per 100K people
- Death rate for hemorrhagic strokes, 2018-20: 7.8 per 100K people
You may also like: Counties with the most college graduates in Utah
#10. Wayne County
Canva
- Age-adjusted rate of all strokes among adults, estimates for 2021: 2.8% (range between 2.5% and 3.2%)
- Death rate for ischemic strokes, 2018-20: 24.7 per 100K people
- Death rate for hemorrhagic strokes, 2018-20: 9.1 per 100K people
- Death rate for ischemic strokes, 2018-20: 24.7 per 100K people
- Death rate for hemorrhagic strokes, 2018-20: 9.1 per 100K people
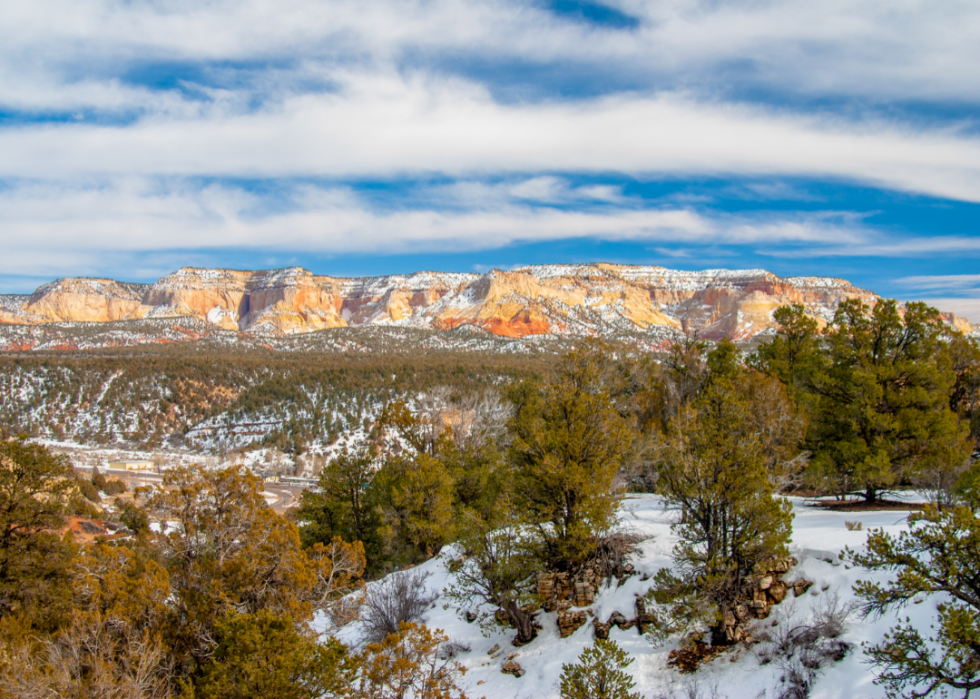
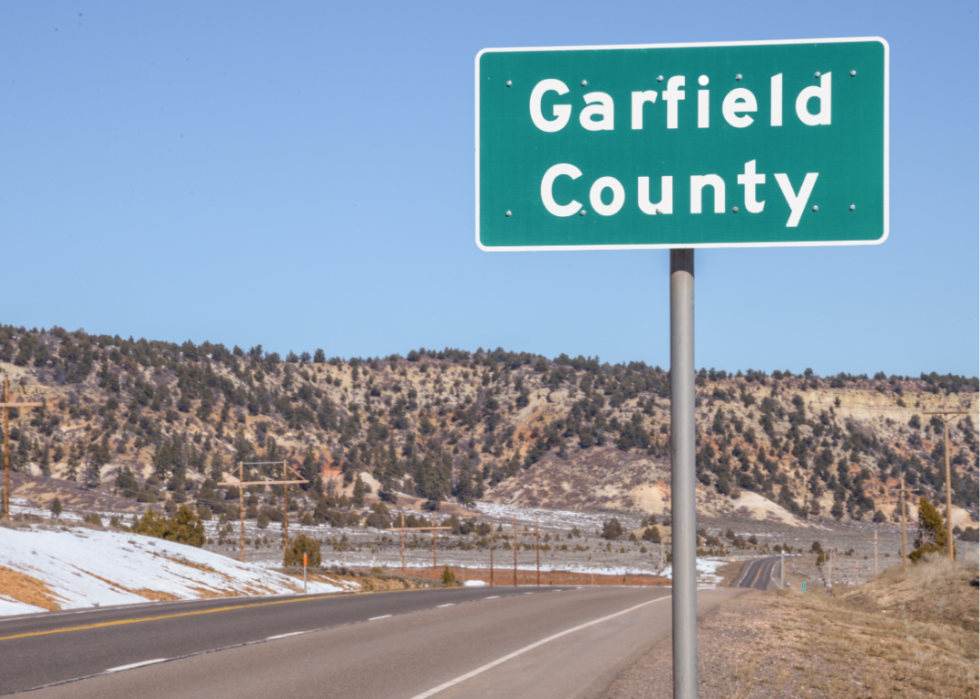
#9. Garfield County
BUI LE MANH HUNG // Shutterstock
- Age-adjusted rate of all strokes among adults, estimates for 2021: 2.9% (range between 2.5% and 3.3%)
- Death rate for ischemic strokes, 2018-20: 21.2 per 100K people
- Death rate for hemorrhagic strokes, 2018-20: 4.8 per 100K people
- Death rate for ischemic strokes, 2018-20: 21.2 per 100K people
- Death rate for hemorrhagic strokes, 2018-20: 4.8 per 100K people
#8. Emery County
Sergey Malomuzh // Shutterstock
- Age-adjusted rate of all strokes among adults, estimates for 2021: 2.9% (range between 2.6% and 3.3%)
- Death rate for ischemic strokes, 2018-20: 21.6 per 100K people
- Death rate for hemorrhagic strokes, 2018-20: 7.2 per 100K people
- Death rate for ischemic strokes, 2018-20: 21.6 per 100K people
- Death rate for hemorrhagic strokes, 2018-20: 7.2 per 100K people
#7. Iron County
Canva
- Age-adjusted rate of all strokes among adults, estimates for 2021: 2.9% (range between 2.5% and 3.3%)
- Death rate for ischemic strokes, 2018-20: 22.7 per 100K people
- Death rate for hemorrhagic strokes, 2018-20: 6.6 per 100K people
- Death rate for ischemic strokes, 2018-20: 22.7 per 100K people
- Death rate for hemorrhagic strokes, 2018-20: 6.6 per 100K people
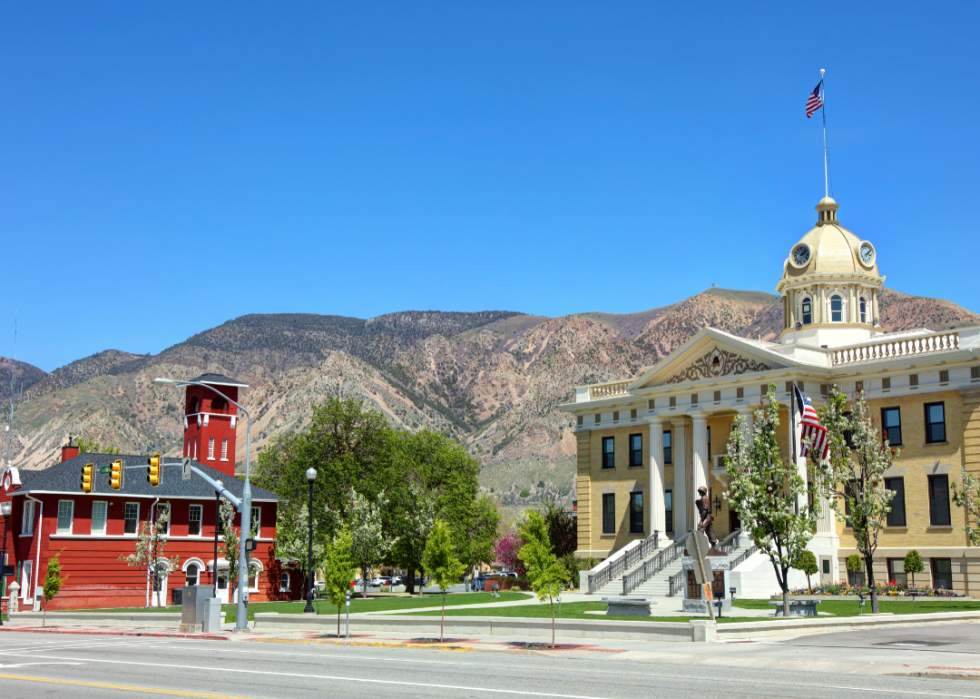
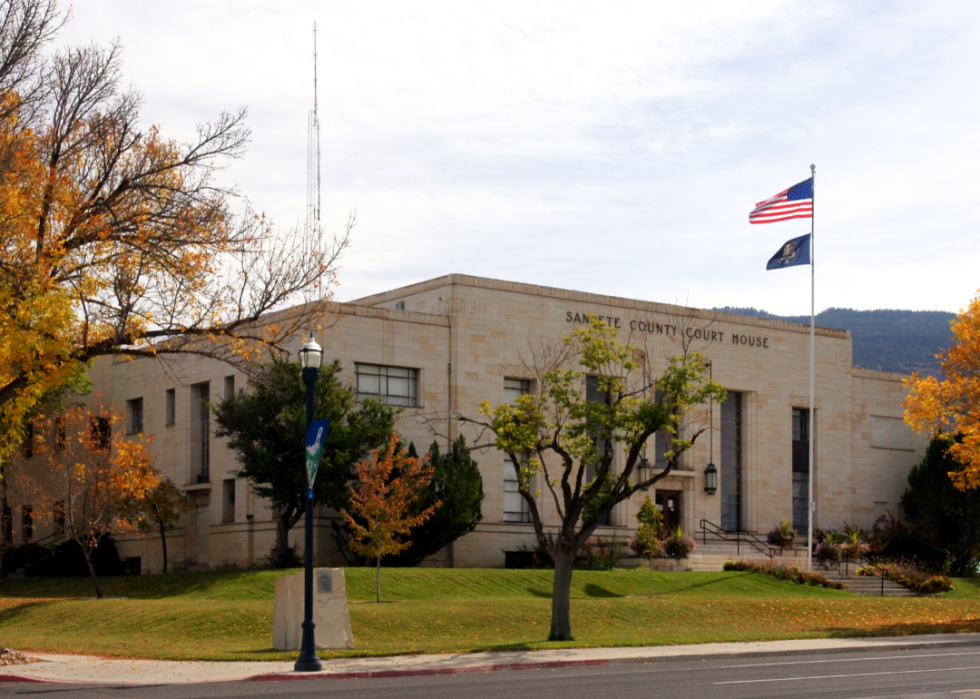
#6. Sanpete County

NickSpinder // Shutterstock
- Age-adjusted rate of all strokes among adults, estimates for 2021: 3.0% (range between 2.6% and 3.4%)
- Death rate for ischemic strokes, 2018-20: 22.0 per 100K people
- Death rate for hemorrhagic strokes, 2018-20: 6.3 per 100K people
- Death rate for ischemic strokes, 2018-20: 22.0 per 100K people
- Death rate for hemorrhagic strokes, 2018-20: 6.3 per 100K people
You may also like: Most popular girl names in the 70s in Utah
#5. Duchesne County
Wangkun Jia // Shutterstock
- Age-adjusted rate of all strokes among adults, estimates for 2021: 3.0% (range between 2.6% and 3.3%)
- Death rate for ischemic strokes, 2018-20: 23.2 per 100K people
- Death rate for hemorrhagic strokes, 2018-20: 6.4 per 100K people
- Death rate for ischemic strokes, 2018-20: 23.2 per 100K people
- Death rate for hemorrhagic strokes, 2018-20: 6.4 per 100K people
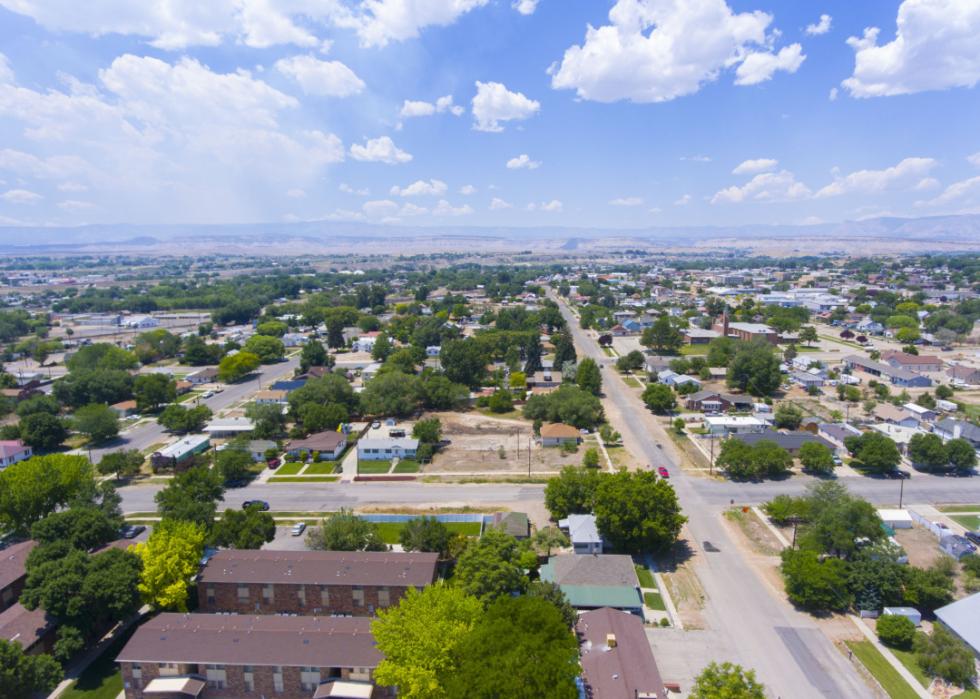
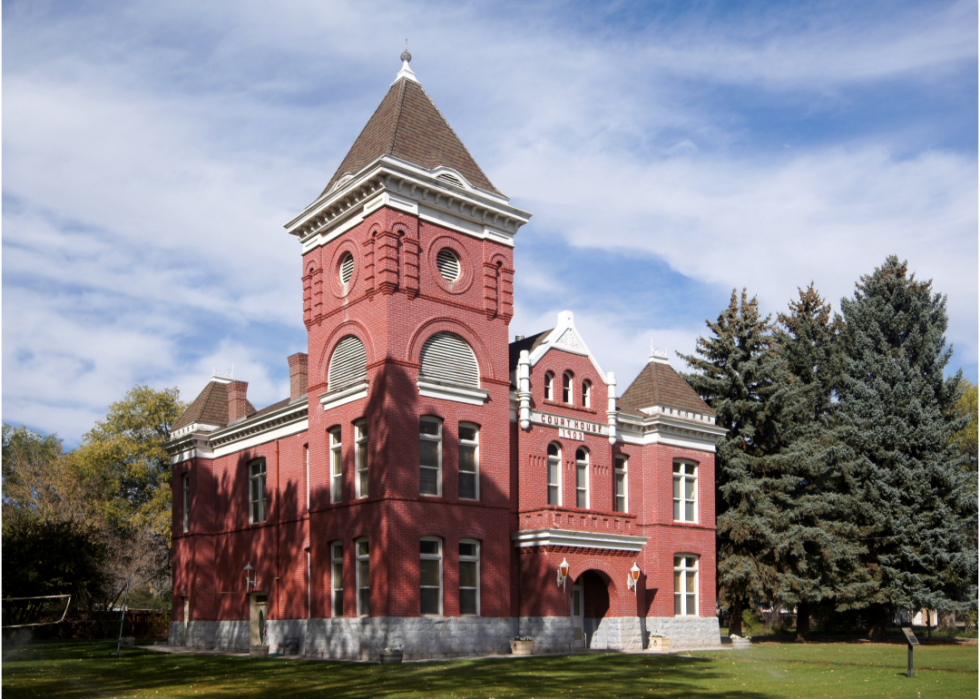
#4. Carbon County
Canva
- Age-adjusted rate of all strokes among adults, estimates for 2021: 3.1% (range between 2.7% and 3.4%)
- Death rate for ischemic strokes, 2018-20: 18.2 per 100K people
- Death rate for hemorrhagic strokes, 2018-20: 6.3 per 100K people
- Death rate for ischemic strokes, 2018-20: 18.2 per 100K people
- Death rate for hemorrhagic strokes, 2018-20: 6.3 per 100K people
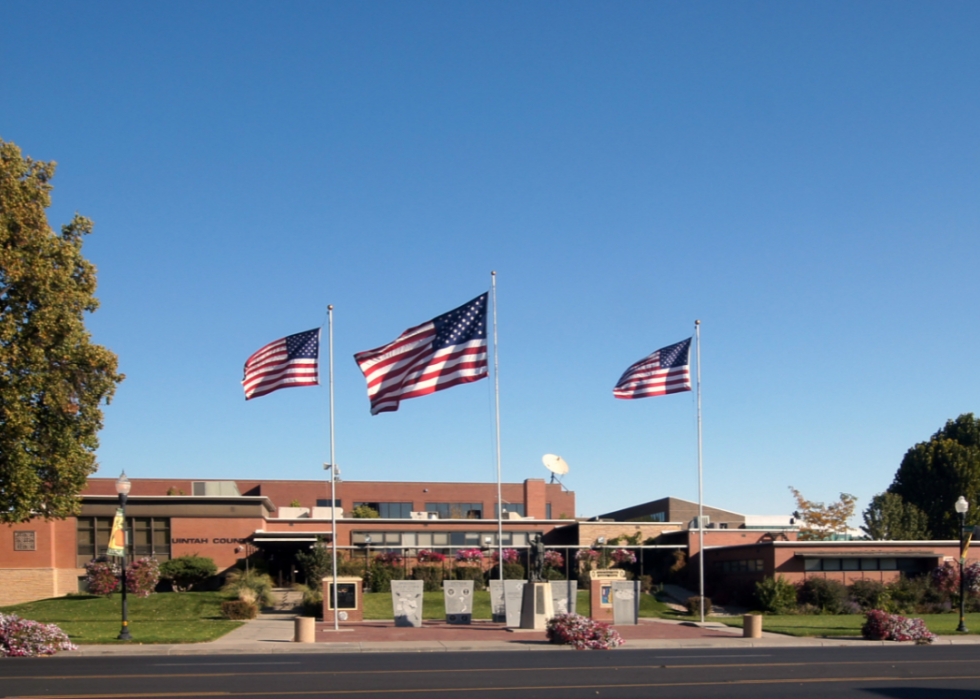
#3. Uintah County
Canva
- Age-adjusted rate of all strokes among adults, estimates for 2021: 3.3% (range between 2.9% and 3.8%)
- Death rate for ischemic strokes, 2018-20: 28.8 per 100K people
- Death rate for hemorrhagic strokes, 2018-20: -1.0 per 100K people
- Death rate for ischemic strokes, 2018-20: 28.8 per 100K people
- Death rate for hemorrhagic strokes, 2018-20: -1.0 per 100K people
#2. Piute County

Canva
- Age-adjusted rate of all strokes among adults, estimates for 2021: 3.9% (range between 3.6% and 4.4%)
- Death rate for ischemic strokes, 2018-20: 17.3 per 100K people
- Death rate for hemorrhagic strokes, 2018-20: 8.4 per 100K people
- Death rate for ischemic strokes, 2018-20: 17.3 per 100K people
- Death rate for hemorrhagic strokes, 2018-20: 8.4 per 100K people
This story features data reporting and writing by Emma Rubin and is part of a series utilizing data automation across 49 states.
#1. San Juan County

Canva