Counties with the highest rates of strokes in Virginia

- Death rate for ischemic strokes, 2018-20: 22.8 per 100K people
- Death rate for hemorrhagic strokes, 2018-20: 9.6 per 100K people

- Death rate for ischemic strokes, 2018-20: 19.5 per 100K people
- Death rate for hemorrhagic strokes, 2018-20: 8.9 per 100K people

- Death rate for ischemic strokes, 2018-20: 22.4 per 100K people
- Death rate for hemorrhagic strokes, 2018-20: 8.3 per 100K people

- Death rate for ischemic strokes, 2018-20: 23.2 per 100K people
- Death rate for hemorrhagic strokes, 2018-20: 9.1 per 100K people

- Death rate for ischemic strokes, 2018-20: 23.6 per 100K people
- Death rate for hemorrhagic strokes, 2018-20: 10.6 per 100K people
You may also like: Highest-rated specialty museums in Virginia, according to Tripadvisor

- Death rate for ischemic strokes, 2018-20: 24.4 per 100K people
- Death rate for hemorrhagic strokes, 2018-20: 10.1 per 100K people

- Death rate for ischemic strokes, 2018-20: 25.4 per 100K people
- Death rate for hemorrhagic strokes, 2018-20: 11.9 per 100K people

- Death rate for ischemic strokes, 2018-20: 25.9 per 100K people
- Death rate for hemorrhagic strokes, 2018-20: 9.5 per 100K people

- Death rate for ischemic strokes, 2018-20: 21.1 per 100K people
- Death rate for hemorrhagic strokes, 2018-20: 9.9 per 100K people

- Death rate for ischemic strokes, 2018-20: 21.4 per 100K people
- Death rate for hemorrhagic strokes, 2018-20: 10.2 per 100K people
You may also like: Most popular baby names for boys of the last decade in Virginia

- Death rate for ischemic strokes, 2018-20: 22.1 per 100K people
- Death rate for hemorrhagic strokes, 2018-20: 10.4 per 100K people

- Death rate for ischemic strokes, 2018-20: 23.5 per 100K people
- Death rate for hemorrhagic strokes, 2018-20: 10.2 per 100K people
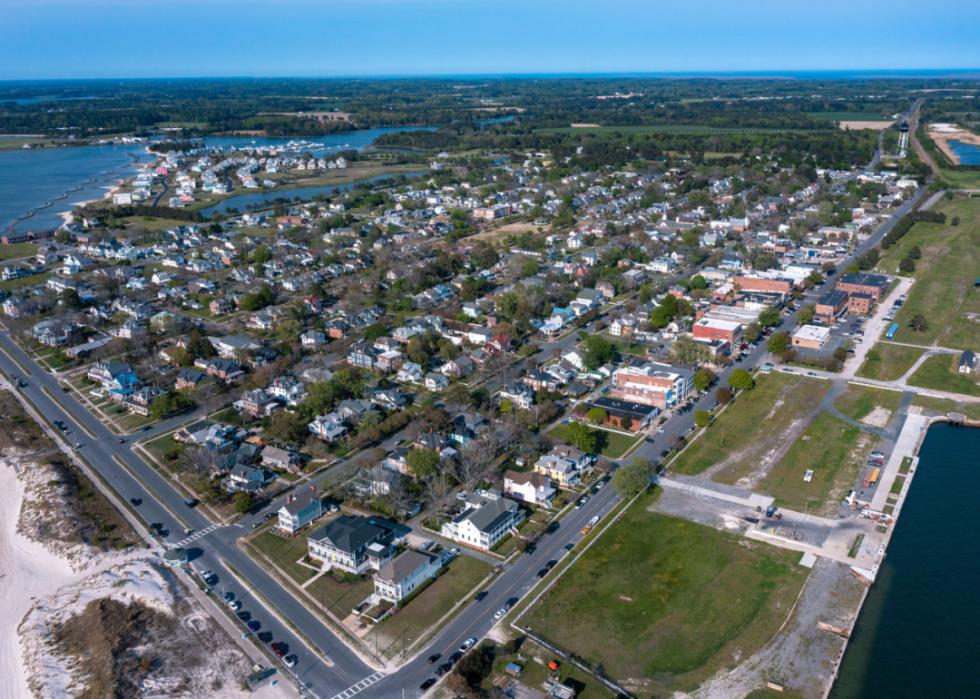
- Death rate for ischemic strokes, 2018-20: 26.0 per 100K people
- Death rate for hemorrhagic strokes, 2018-20: 14.9 per 100K people

- Death rate for ischemic strokes, 2018-20: 20.3 per 100K people
- Death rate for hemorrhagic strokes, 2018-20: 8.9 per 100K people

- Death rate for ischemic strokes, 2018-20: 23.4 per 100K people
- Death rate for hemorrhagic strokes, 2018-20: 9.2 per 100K people
You may also like: Counties with the worst commutes in Virginia

- Death rate for ischemic strokes, 2018-20: 23.8 per 100K people
- Death rate for hemorrhagic strokes, 2018-20: 10.8 per 100K people

- Death rate for ischemic strokes, 2018-20: 26.0 per 100K people
- Death rate for hemorrhagic strokes, 2018-20: 11.3 per 100K people

- Death rate for ischemic strokes, 2018-20: 27.3 per 100K people
- Death rate for hemorrhagic strokes, 2018-20: 12.2 per 100K people

- Death rate for ischemic strokes, 2018-20: 27.7 per 100K people
- Death rate for hemorrhagic strokes, 2018-20: 7.7 per 100K people

- Death rate for ischemic strokes, 2018-20: 29.7 per 100K people
- Death rate for hemorrhagic strokes, 2018-20: 14.6 per 100K people
You may also like: Most popular baby names for girls in Virginia

- Death rate for ischemic strokes, 2018-20: 22.2 per 100K people
- Death rate for hemorrhagic strokes, 2018-20: 9.5 per 100K people

- Death rate for ischemic strokes, 2018-20: 23.7 per 100K people
- Death rate for hemorrhagic strokes, 2018-20: 9.1 per 100K people

- Death rate for ischemic strokes, 2018-20: 23.8 per 100K people
- Death rate for hemorrhagic strokes, 2018-20: 11.4 per 100K people

- Death rate for ischemic strokes, 2018-20: 24.6 per 100K people
- Death rate for hemorrhagic strokes, 2018-20: 7.1 per 100K people
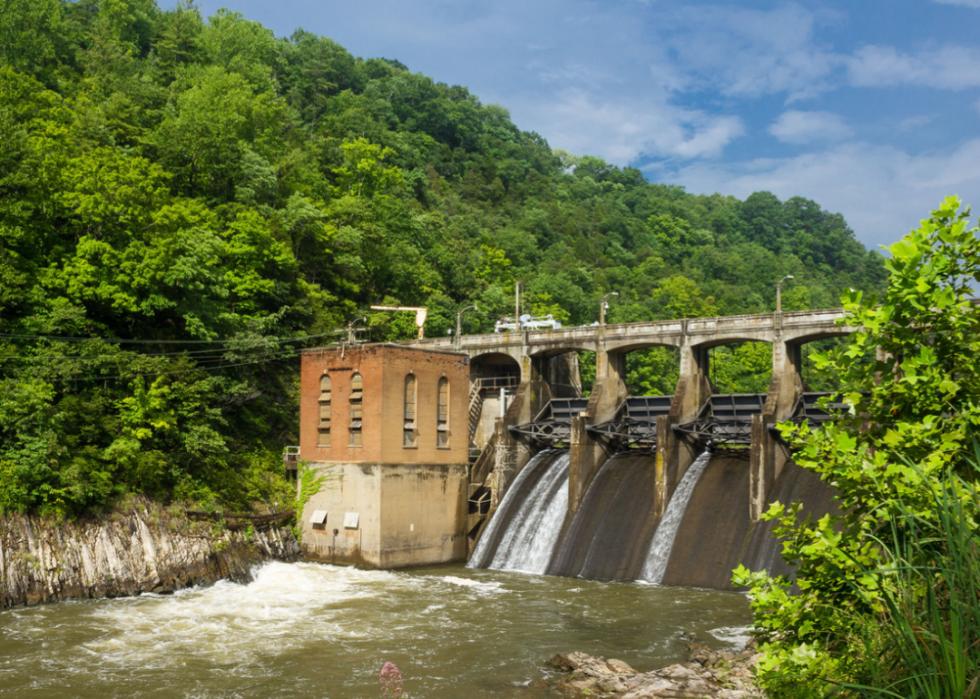
- Death rate for ischemic strokes, 2018-20: 24.8 per 100K people
- Death rate for hemorrhagic strokes, 2018-20: 9.5 per 100K people
You may also like: What to know about workers' compensation in Virginia

- Death rate for ischemic strokes, 2018-20: 27.7 per 100K people
- Death rate for hemorrhagic strokes, 2018-20: 11.3 per 100K people

- Death rate for ischemic strokes, 2018-20: 22.5 per 100K people
- Death rate for hemorrhagic strokes, 2018-20: 9.6 per 100K people

- Death rate for ischemic strokes, 2018-20: 23.2 per 100K people
- Death rate for hemorrhagic strokes, 2018-20: 8.8 per 100K people

- Death rate for ischemic strokes, 2018-20: 24.6 per 100K people
- Death rate for hemorrhagic strokes, 2018-20: 7.5 per 100K people

- Death rate for ischemic strokes, 2018-20: 25.7 per 100K people
- Death rate for hemorrhagic strokes, 2018-20: 8.9 per 100K people
You may also like: Virginia's climate has warmed by 1.58° F since 1970

- Death rate for ischemic strokes, 2018-20: 27.5 per 100K people
- Death rate for hemorrhagic strokes, 2018-20: 12.0 per 100K people

- Death rate for ischemic strokes, 2018-20: 28.1 per 100K people
- Death rate for hemorrhagic strokes, 2018-20: 9.6 per 100K people
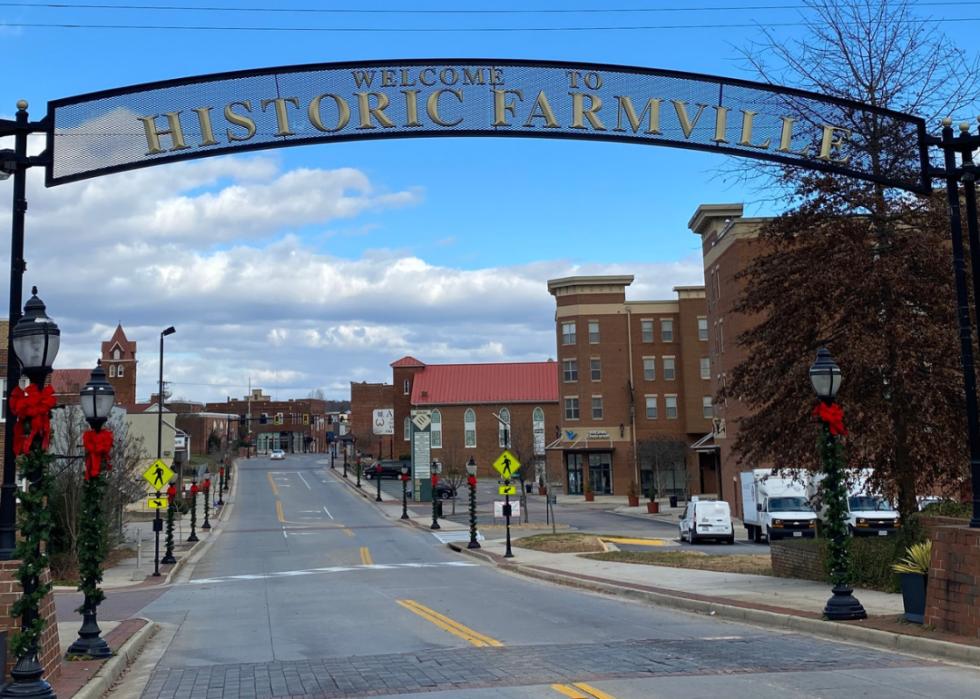
- Death rate for ischemic strokes, 2018-20: 22.7 per 100K people
- Death rate for hemorrhagic strokes, 2018-20: 11.0 per 100K people

- Death rate for ischemic strokes, 2018-20: 23.1 per 100K people
- Death rate for hemorrhagic strokes, 2018-20: 9.0 per 100K people

- Death rate for ischemic strokes, 2018-20: 23.8 per 100K people
- Death rate for hemorrhagic strokes, 2018-20: 10.7 per 100K people
You may also like: Counties with highest COVID-19 infection rates in Virginia

- Death rate for ischemic strokes, 2018-20: 25.5 per 100K people
- Death rate for hemorrhagic strokes, 2018-20: 10.1 per 100K people

- Death rate for ischemic strokes, 2018-20: 30.3 per 100K people
- Death rate for hemorrhagic strokes, 2018-20: 10.9 per 100K people

- Death rate for ischemic strokes, 2018-20: 20.6 per 100K people
- Death rate for hemorrhagic strokes, 2018-20: 8.7 per 100K people

- Death rate for ischemic strokes, 2018-20: 23.0 per 100K people
- Death rate for hemorrhagic strokes, 2018-20: 8.8 per 100K people

- Death rate for ischemic strokes, 2018-20: 23.2 per 100K people
- Death rate for hemorrhagic strokes, 2018-20: 9.3 per 100K people
You may also like: Best public high schools in Virginia

- Death rate for ischemic strokes, 2018-20: 25.6 per 100K people
- Death rate for hemorrhagic strokes, 2018-20: 10.4 per 100K people
- Death rate for ischemic strokes, 2018-20: 27.7 per 100K people
- Death rate for hemorrhagic strokes, 2018-20: 7.8 per 100K people

- Death rate for ischemic strokes, 2018-20: 25.2 per 100K people
- Death rate for hemorrhagic strokes, 2018-20: 10.3 per 100K people

- Death rate for ischemic strokes, 2018-20: 25.9 per 100K people
- Death rate for hemorrhagic strokes, 2018-20: 17.0 per 100K people
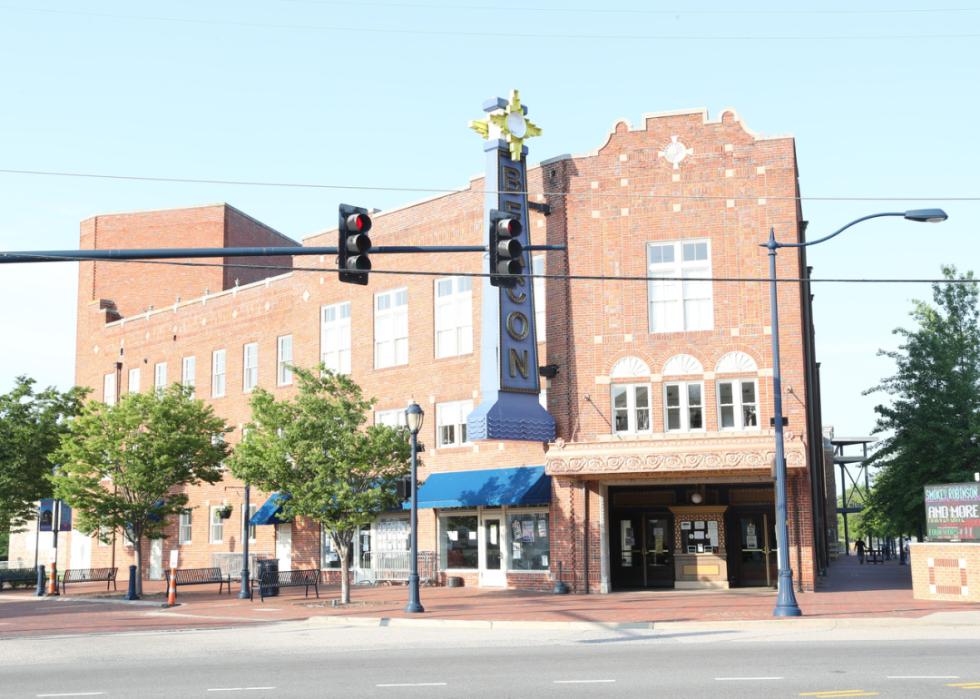
- Death rate for ischemic strokes, 2018-20: 22.4 per 100K people
- Death rate for hemorrhagic strokes, 2018-20: 10.0 per 100K people
You may also like: Best high schools in Virginia

- Death rate for ischemic strokes, 2018-20: 26.0 per 100K people
- Death rate for hemorrhagic strokes, 2018-20: 12.0 per 100K people

- Death rate for ischemic strokes, 2018-20: 26.4 per 100K people
- Death rate for hemorrhagic strokes, 2018-20: 7.8 per 100K people

- Death rate for ischemic strokes, 2018-20: 27.8 per 100K people
- Death rate for hemorrhagic strokes, 2018-20: 7.2 per 100K people

- Death rate for ischemic strokes, 2018-20: 30.5 per 100K people
- Death rate for hemorrhagic strokes, 2018-20: 9.9 per 100K people

- Death rate for ischemic strokes, 2018-20: 38.0 per 100K people
- Death rate for hemorrhagic strokes, 2018-20: 11.8 per 100K people
You may also like: Highest NFL draft picks from Virginia
This story features data reporting and writing by Emma Rubin and is part of a series utilizing data automation across 49 states.
