Counties with the most bridges in dire need of repair in Virginia
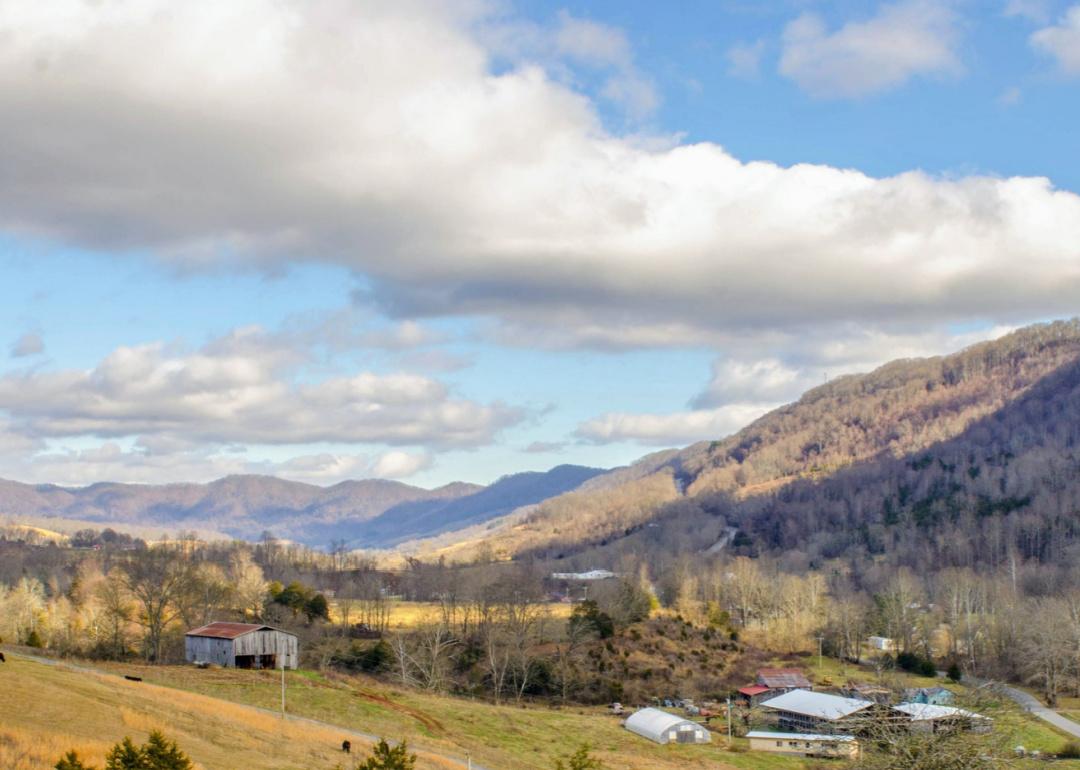
- Bridges in poor condition: 8.4% (13 of 154 bridges)
- Square meters of bridges in poor condition: 4.2% (2,170 of 51,110 square meters of bridges)

- Bridges in poor condition: 8.5% (6 of 71 bridges)
- Square meters of bridges in poor condition: 3.1% (1,969 of 63,370 square meters of bridges)
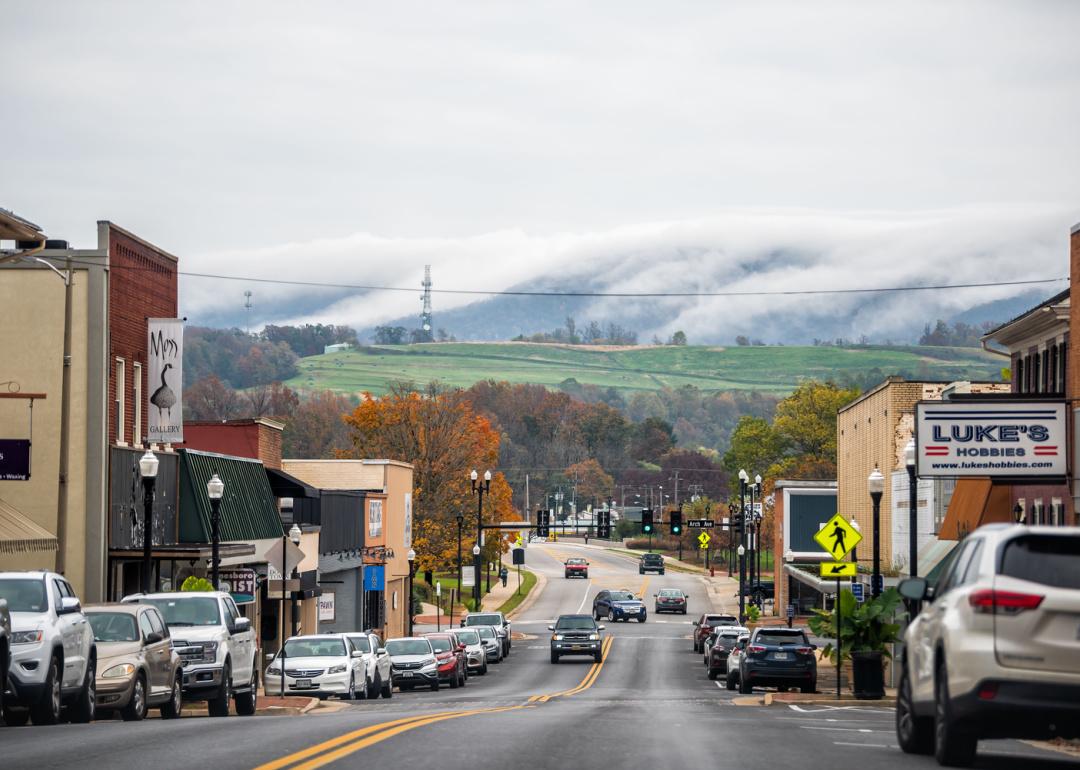
- Bridges in poor condition: 8.7% (2 of 23 bridges)
- Square meters of bridges in poor condition: 4.2% (705 of 16,911 square meters of bridges)

- Bridges in poor condition: 9.0% (11 of 122 bridges)
- Square meters of bridges in poor condition: 4.6% (1,818 of 39,832 square meters of bridges)
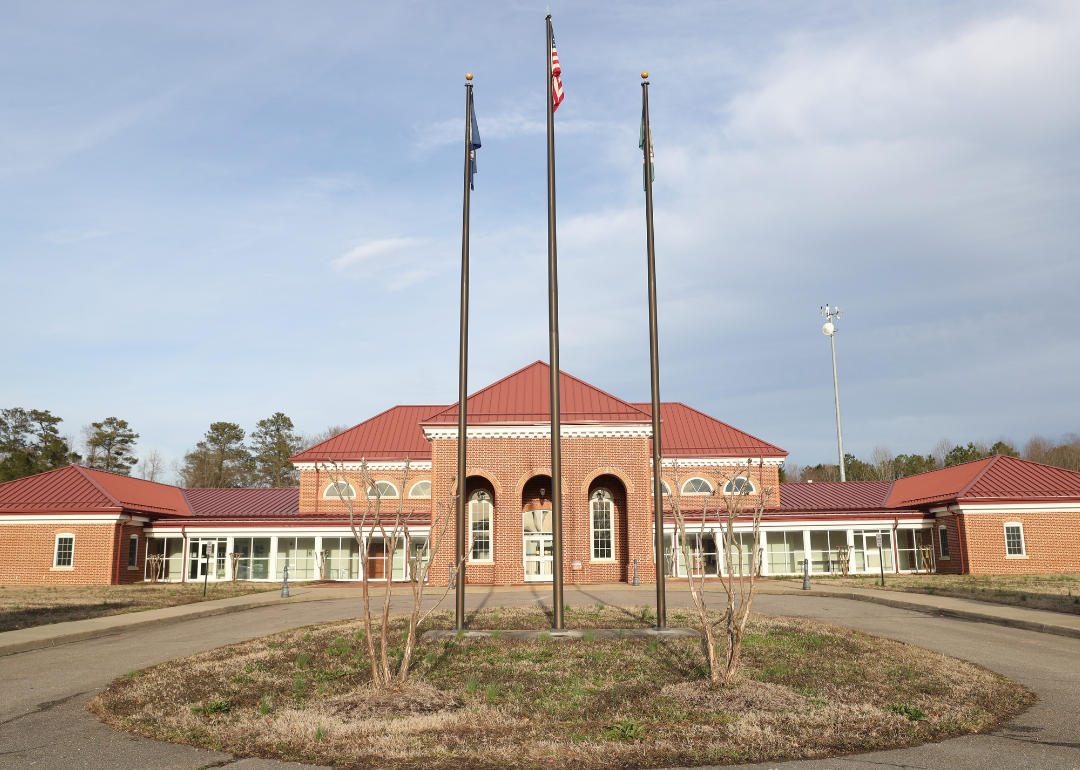
- Bridges in poor condition: 9.1% (2 of 22 bridges)
- Square meters of bridges in poor condition: 0.8% (134 of 17,541 square meters of bridges)
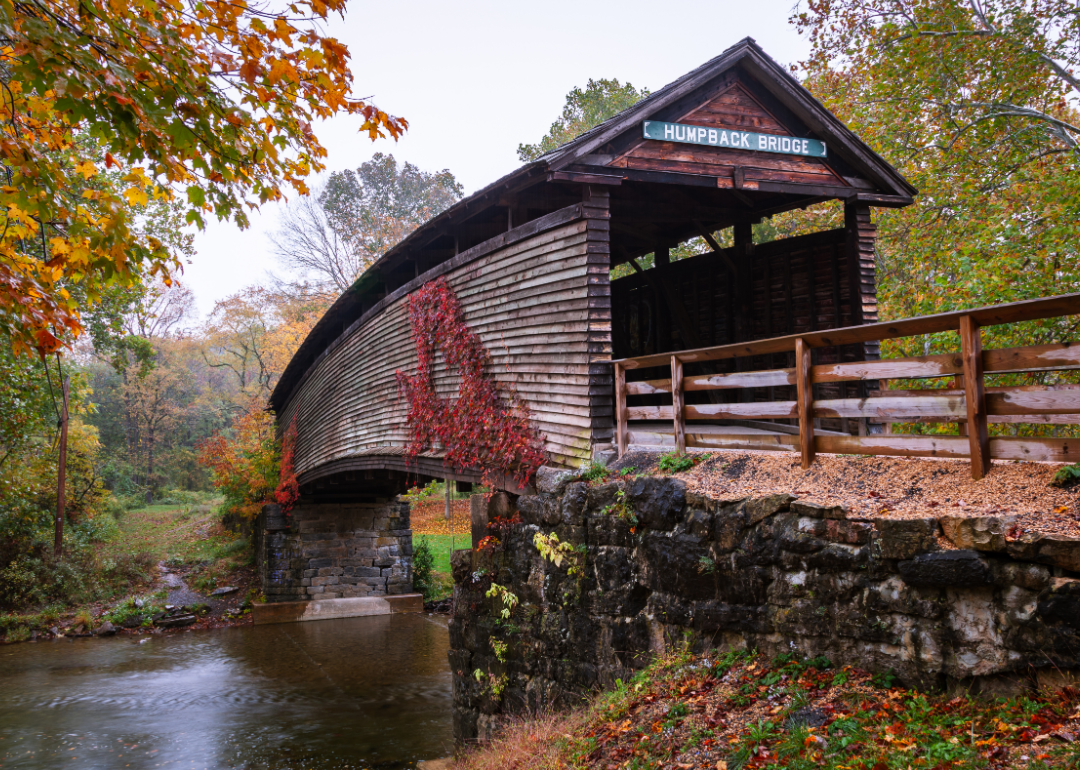
- Bridges in poor condition: 9.1% (1 of 11 bridges)
- Square meters of bridges in poor condition: 5.3% (640 of 12,174 square meters of bridges)
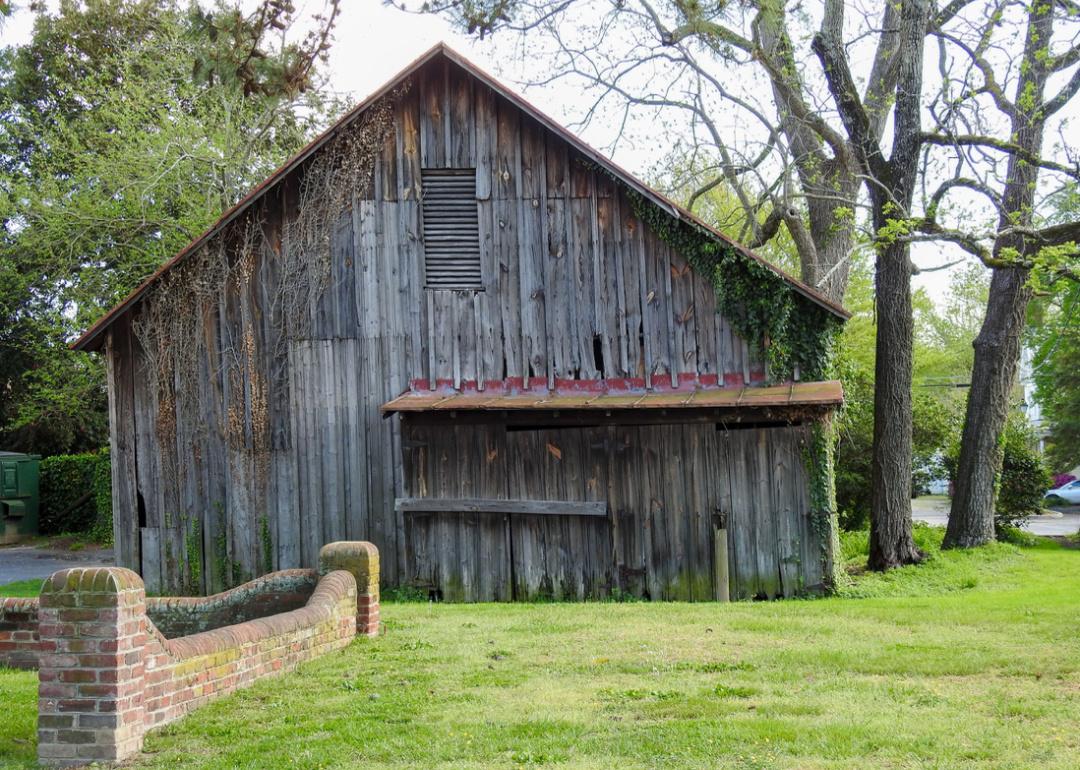
- Bridges in poor condition: 11.1% (1 of 9 bridges)
- Square meters of bridges in poor condition: 0.9% (261 of 28,998 square meters of bridges)
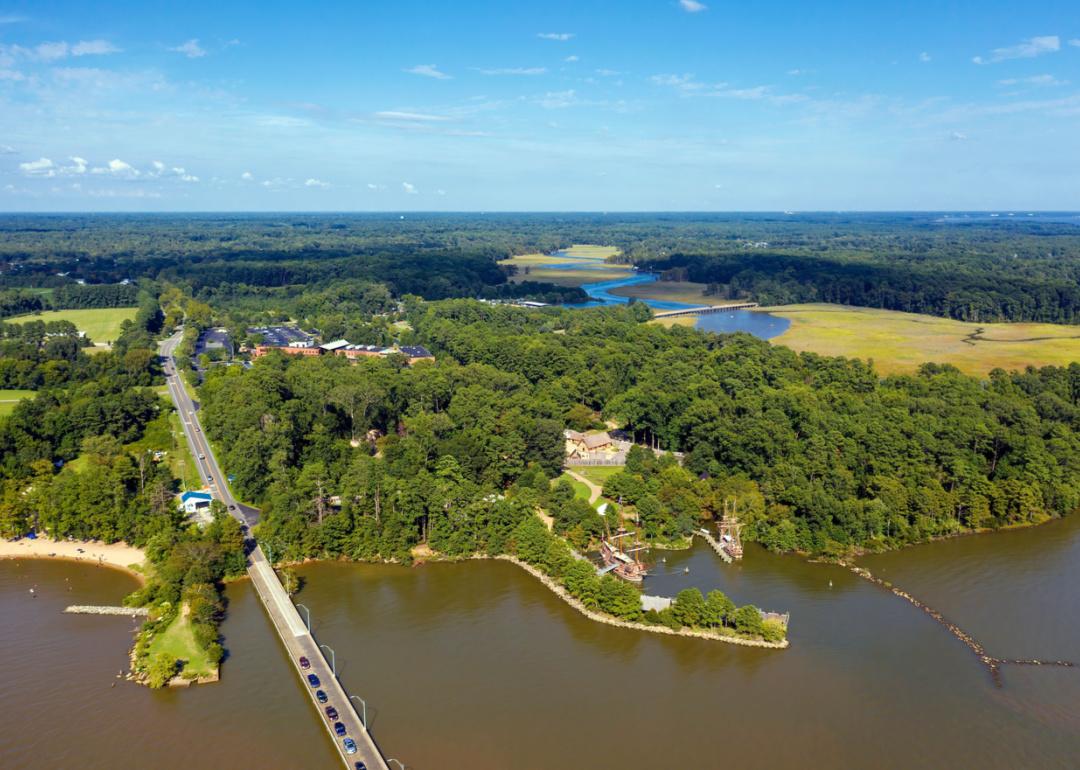
- Bridges in poor condition: 11.1% (4 of 36 bridges)
- Square meters of bridges in poor condition: 2.7% (1,236 of 46,181 square meters of bridges)

- Bridges in poor condition: 11.2% (10 of 89 bridges)
- Square meters of bridges in poor condition: 4.7% (836 of 17,694 square meters of bridges)

- Bridges in poor condition: 11.4% (21 of 184 bridges)
- Square meters of bridges in poor condition: 6.7% (24,756 of 371,453 square meters of bridges)

- Bridges in poor condition: 11.5% (10 of 87 bridges)
- Square meters of bridges in poor condition: 4.0% (7,913 of 197,253 square meters of bridges)
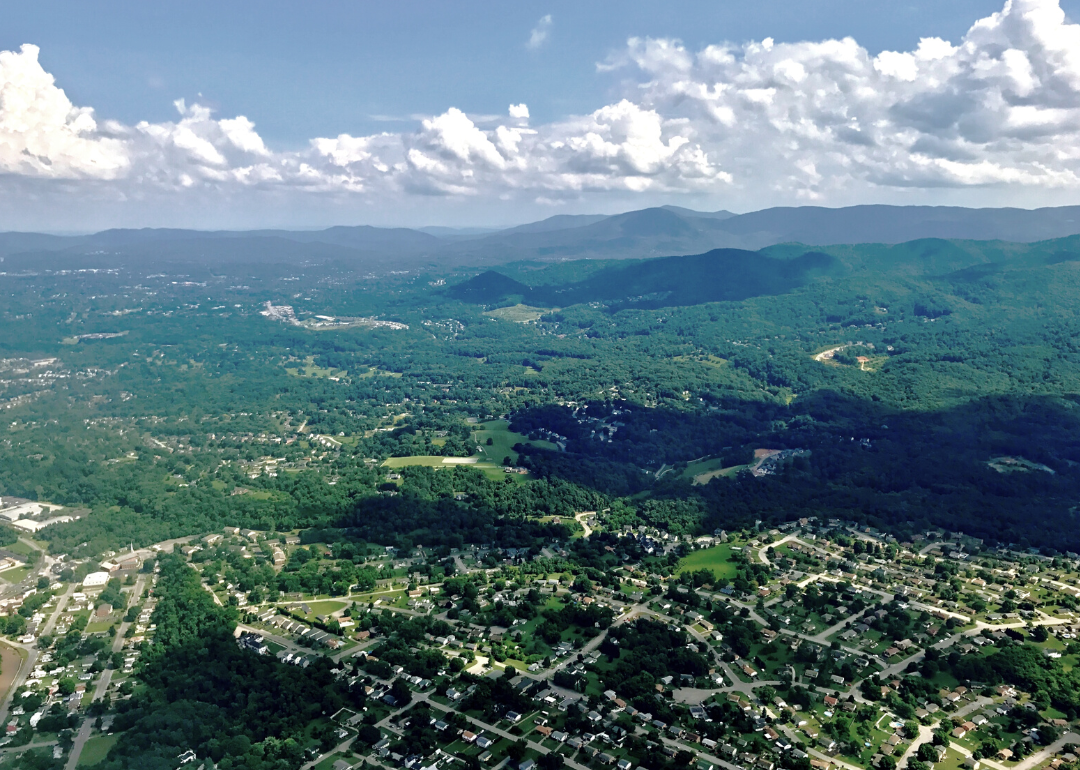
- Bridges in poor condition: 11.8% (2 of 17 bridges)
- Square meters of bridges in poor condition: 14.2% (1,913 of 13,482 square meters of bridges)

- Bridges in poor condition: 11.8% (6 of 51 bridges)
- Square meters of bridges in poor condition: 19.1% (7,313 of 38,239 square meters of bridges)

- Bridges in poor condition: 12.0% (3 of 25 bridges)
- Square meters of bridges in poor condition: 10.3% (1,936 of 18,834 square meters of bridges)
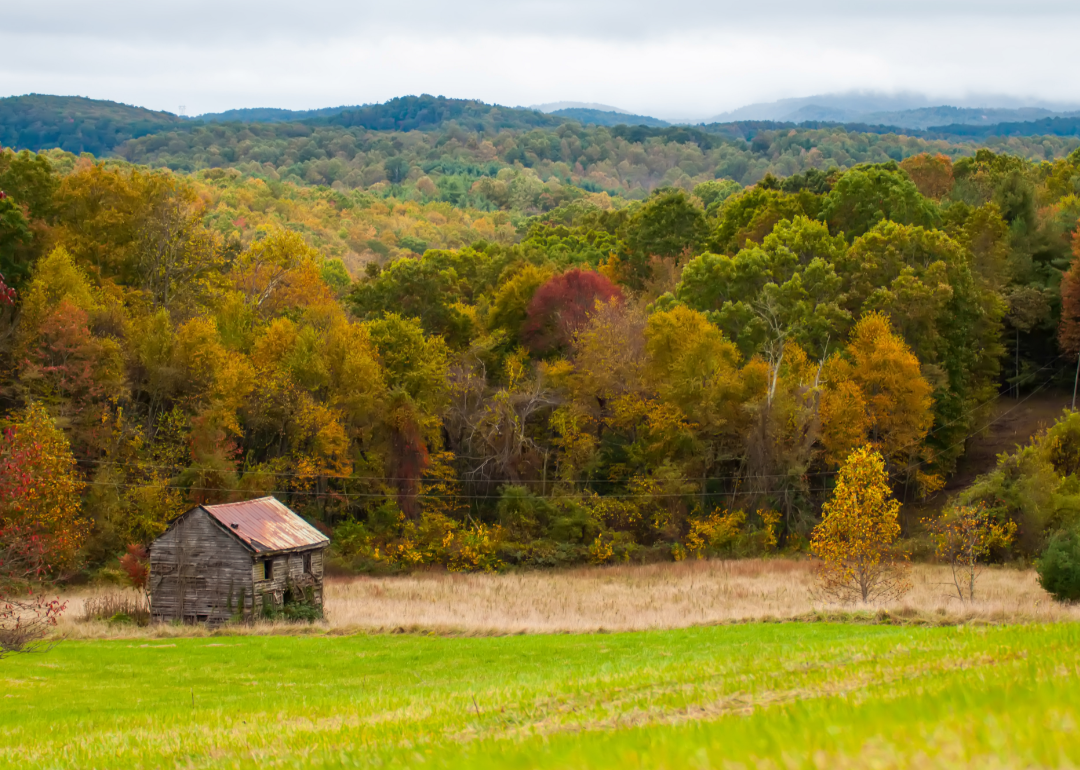
- Bridges in poor condition: 12.5% (1 of 8 bridges)
- Square meters of bridges in poor condition: 2.9% (55 of 1,885 square meters of bridges)
- Bridges in poor condition: 15.0% (3 of 20 bridges)
- Square meters of bridges in poor condition: 19.4% (4,147 of 21,414 square meters of bridges)
- Bridges in poor condition: 22.2% (2 of 9 bridges)
- Square meters of bridges in poor condition: 16.4% (416 of 2,536 square meters of bridges)

- Bridges in poor condition: 26.9% (7 of 26 bridges)
- Square meters of bridges in poor condition: 56.3% (8,564 of 15,211 square meters of bridges)

- Bridges in poor condition: 33.3% (2 of 6 bridges)
- Square meters of bridges in poor condition: 6.2% (505 of 8,200 square meters of bridges)

- Bridges in poor condition: 40.0% (2 of 5 bridges)
- Square meters of bridges in poor condition: 13.8% (228 of 1,652 square meters of bridges)
