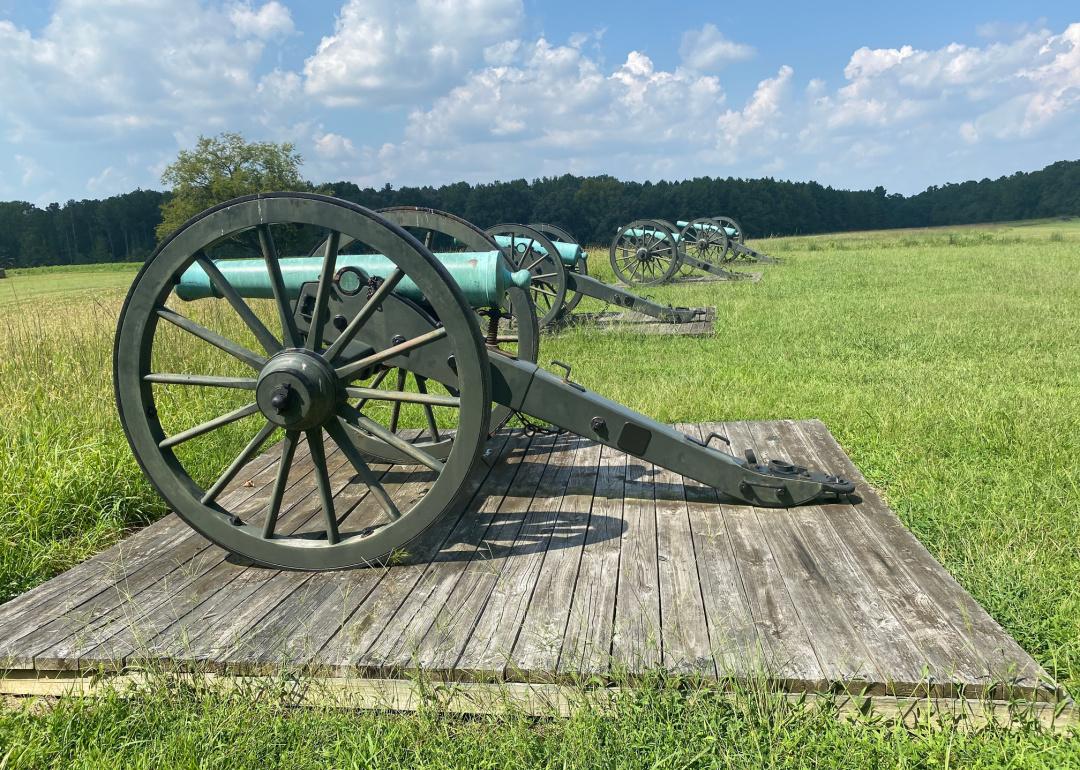
Counties with the most tornadoes in Virginia
Stacker
Jon Marc Lyttle / Shutterstock
- Tornadoes since 2000: 8 (1.06 per 100 square miles)
- #1,742 nationally
- Tornadoes this year, as of May 31: 0
- #1,742 nationally
- Tornadoes this year, as of May 31: 0
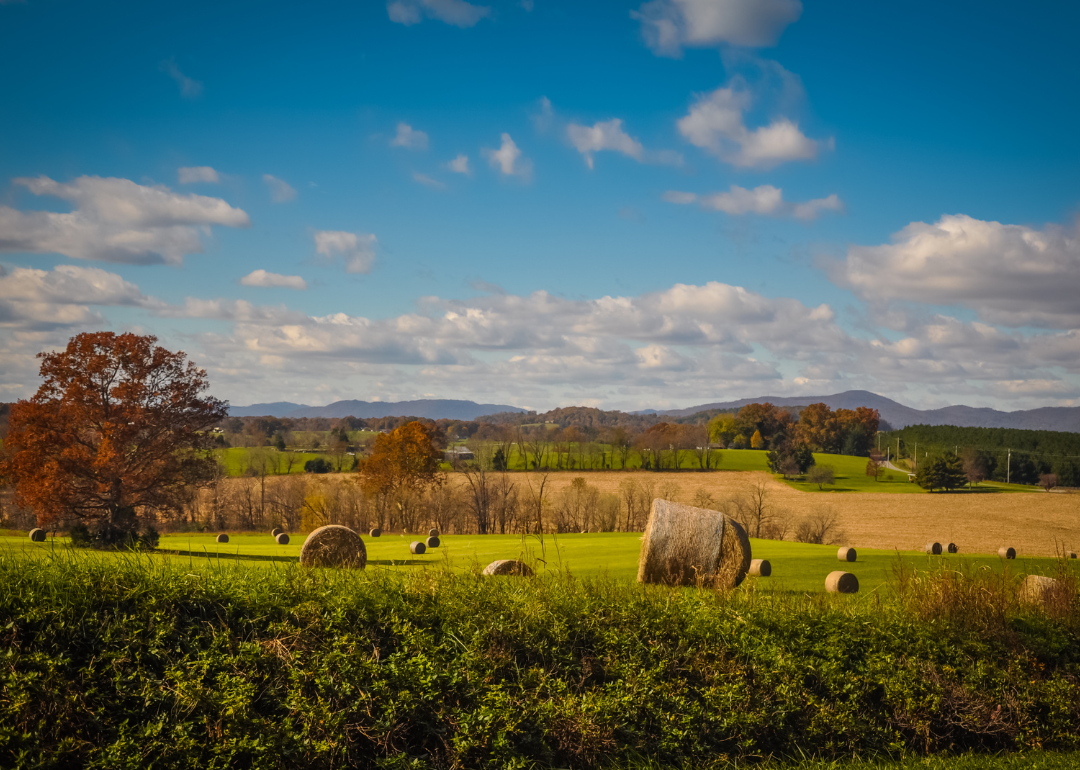
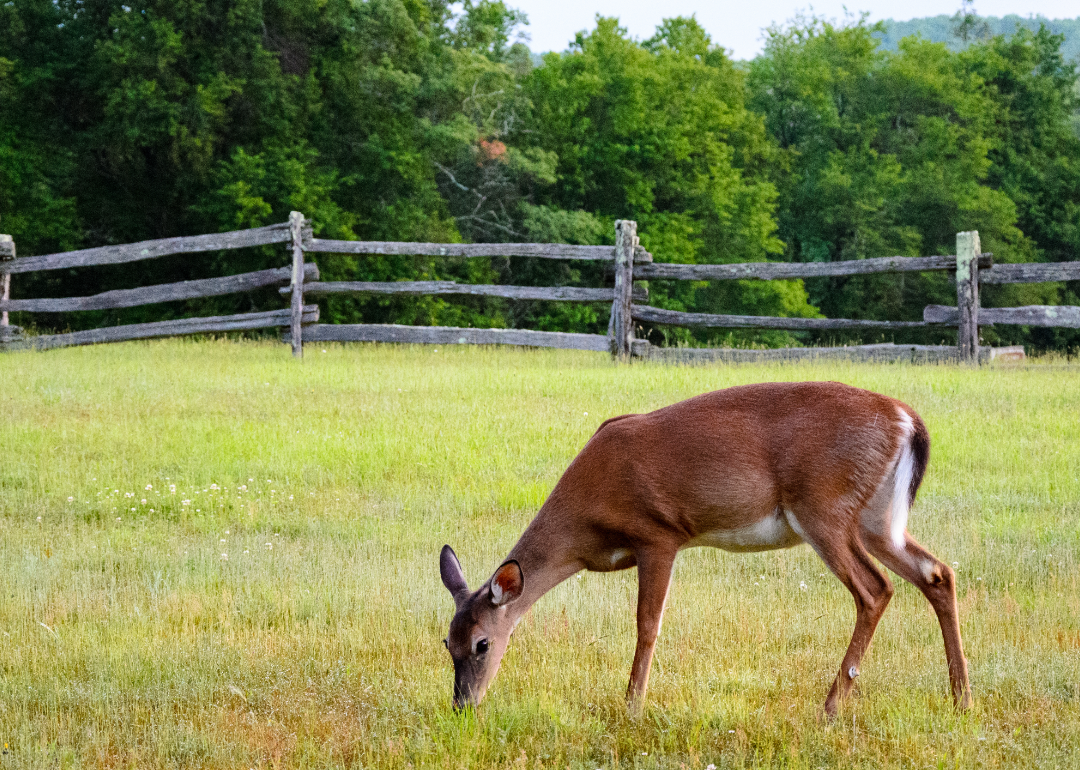
#50. Bedford County

Canva
- Tornadoes since 2000: 6 (1.07 per 100 square miles)
- #1,739 nationally
- Tornadoes this year, as of May 31: 0
- #1,739 nationally
- Tornadoes this year, as of May 31: 0
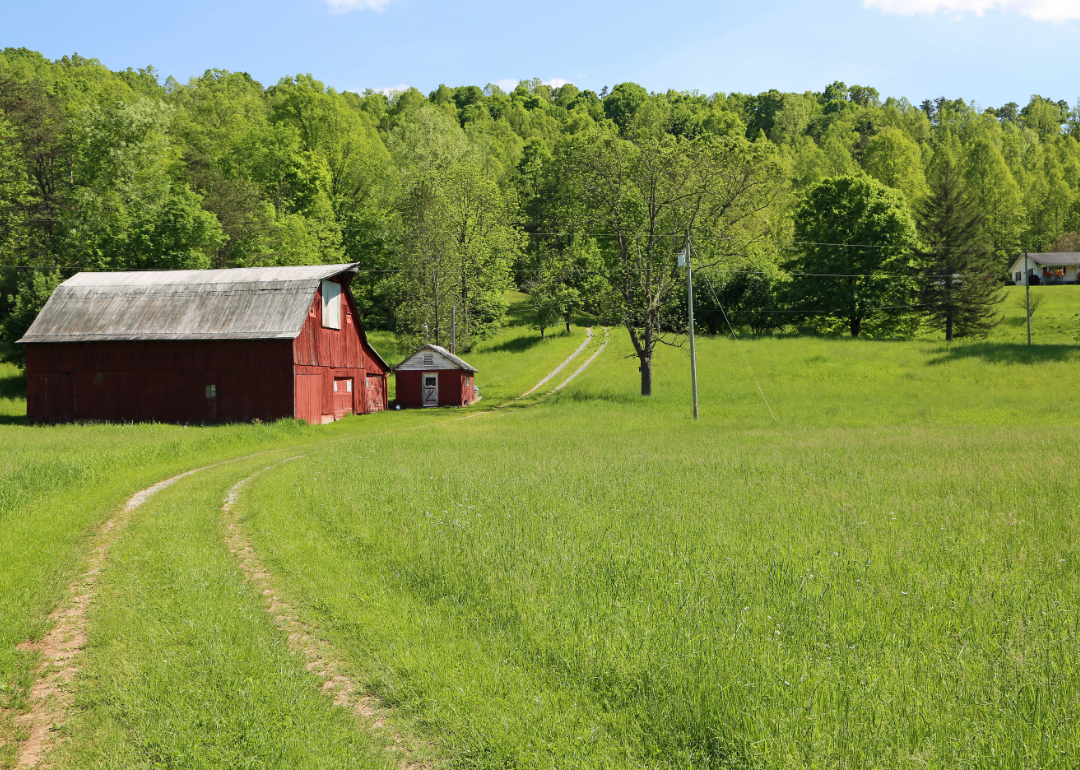
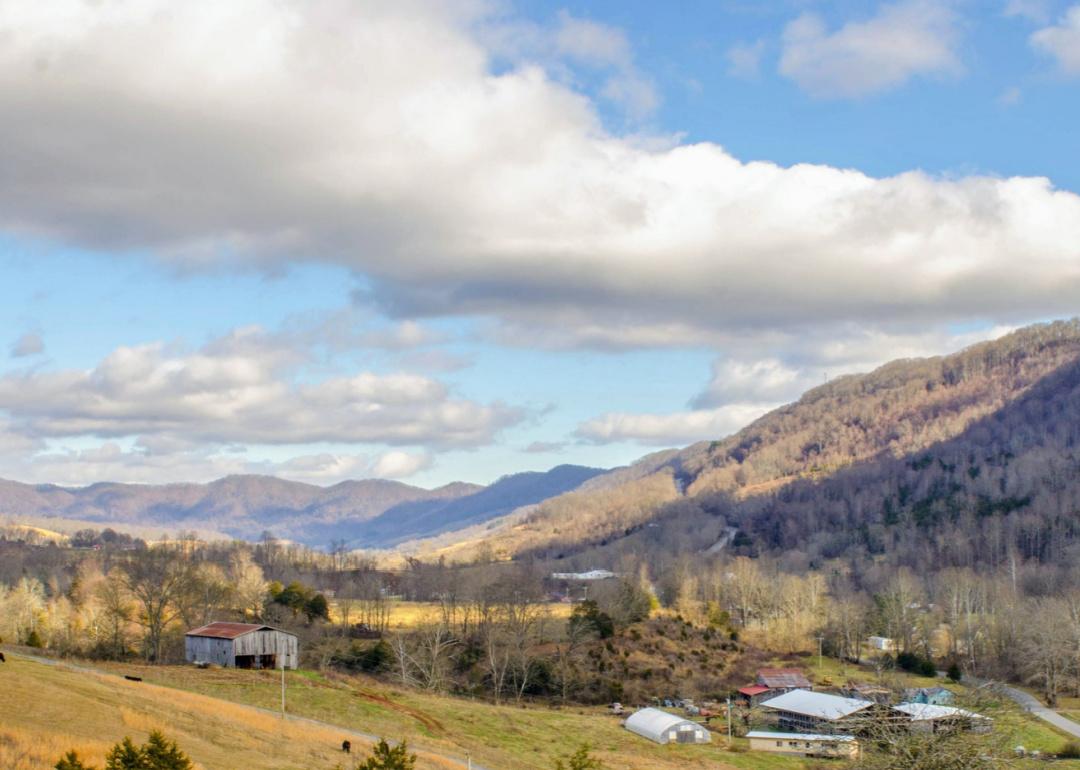
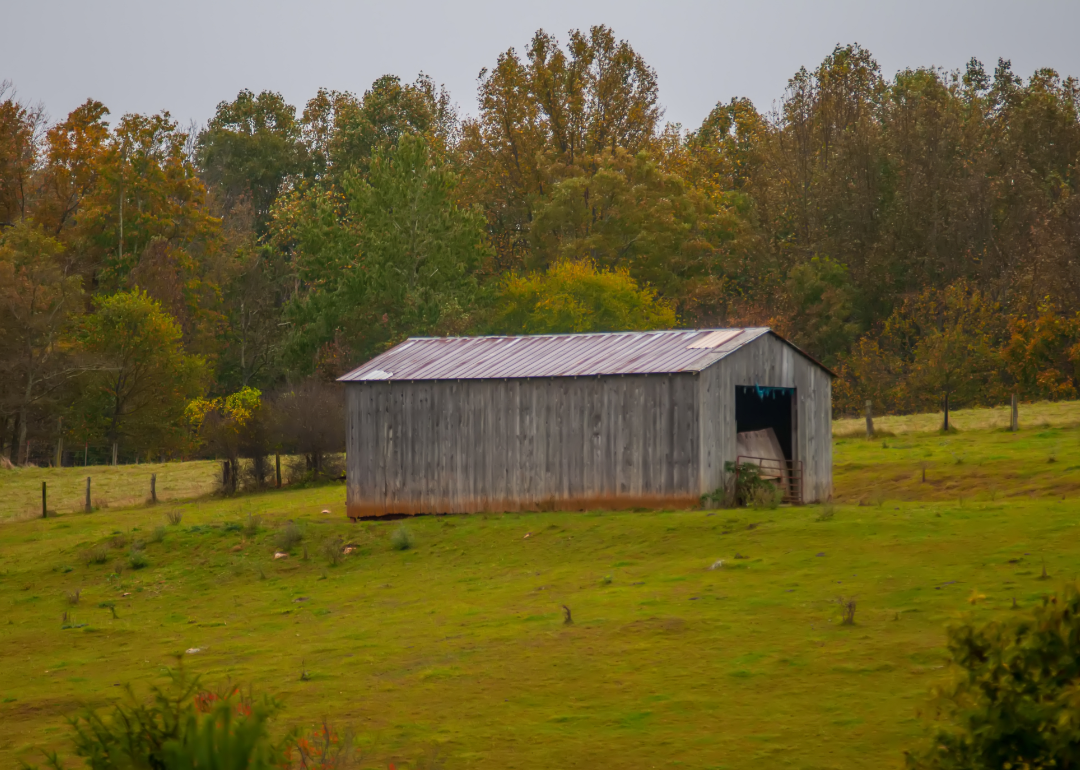
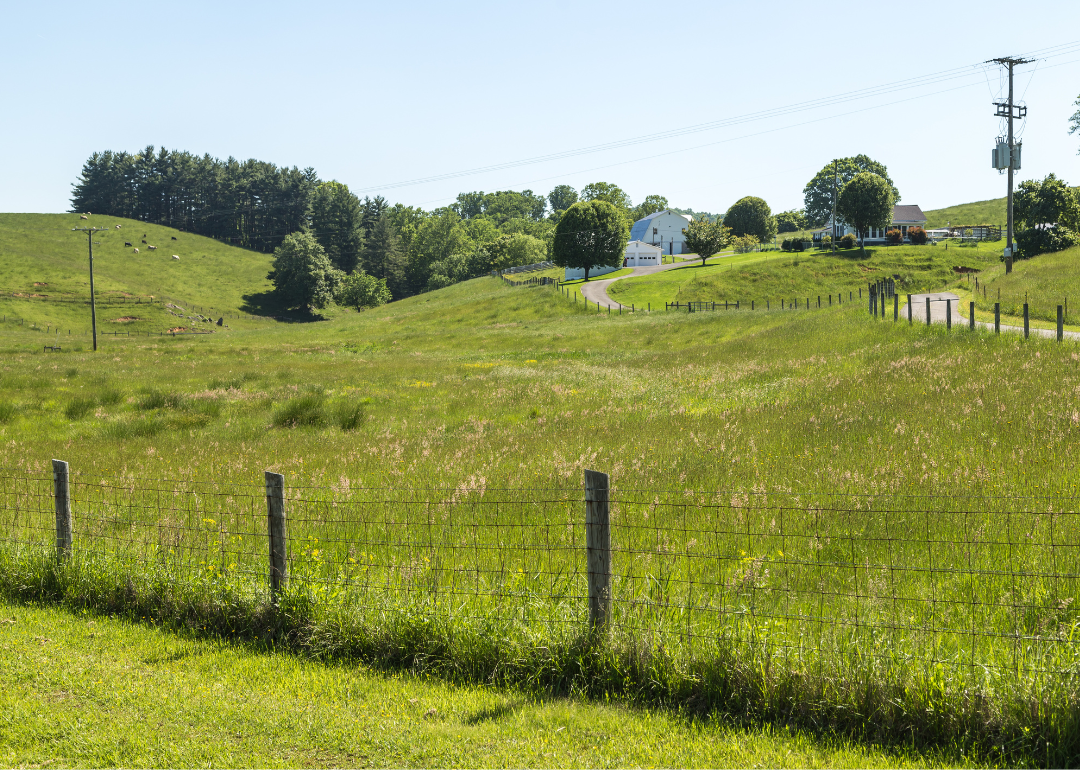
#49. Washington County

Canva
- Tornadoes since 2000: 9 (1.10 per 100 square miles)
- #1,720 nationally
- Tornadoes this year, as of May 31: 0
- #1,720 nationally
- Tornadoes this year, as of May 31: 0
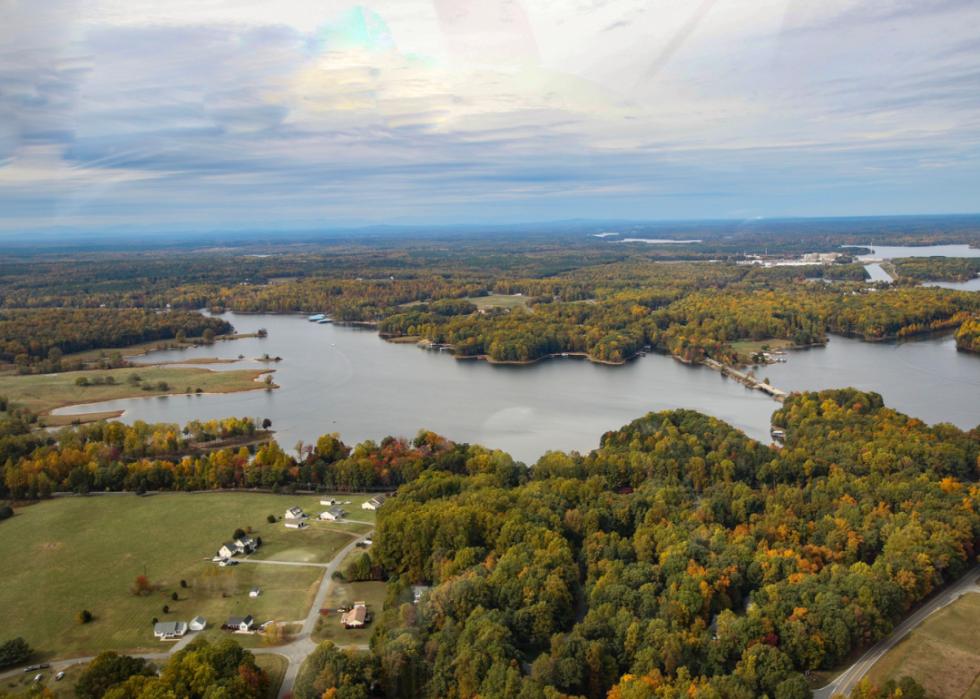
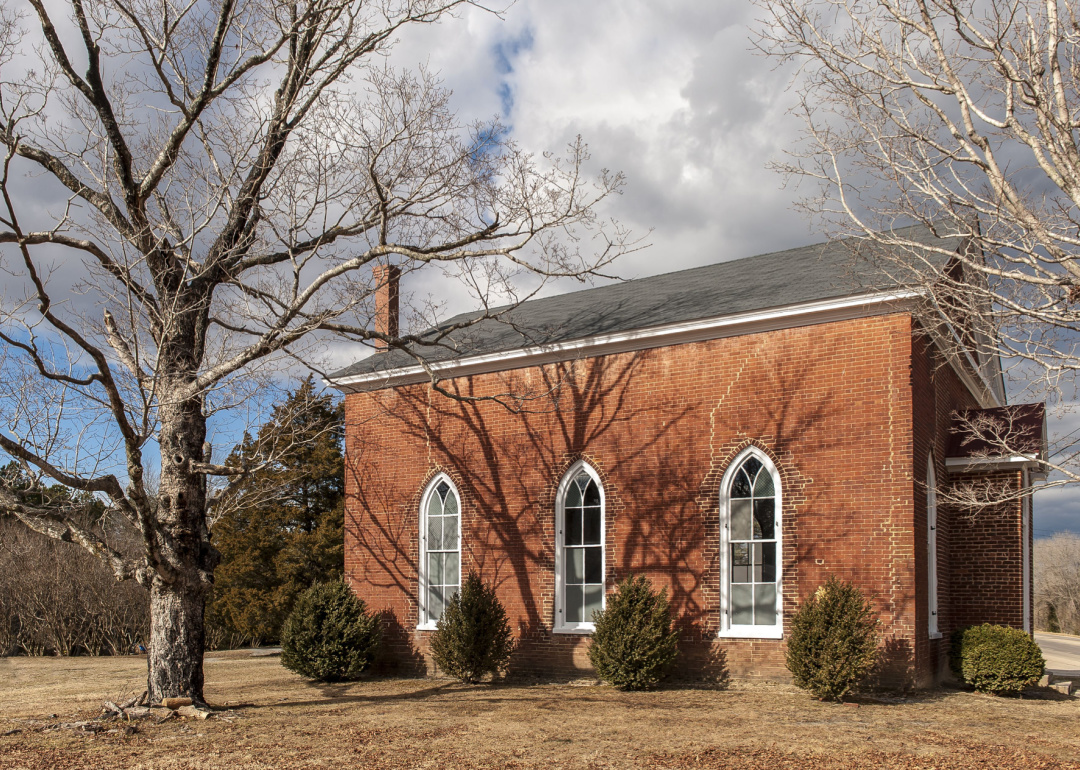
#48. Halifax County

ImagineerInc // Shutterstock
- Tornadoes since 2000: 8 (1.11 per 100 square miles)
- #1,711 nationally
- Tornadoes this year, as of May 31: 0
- #1,711 nationally
- Tornadoes this year, as of May 31: 0
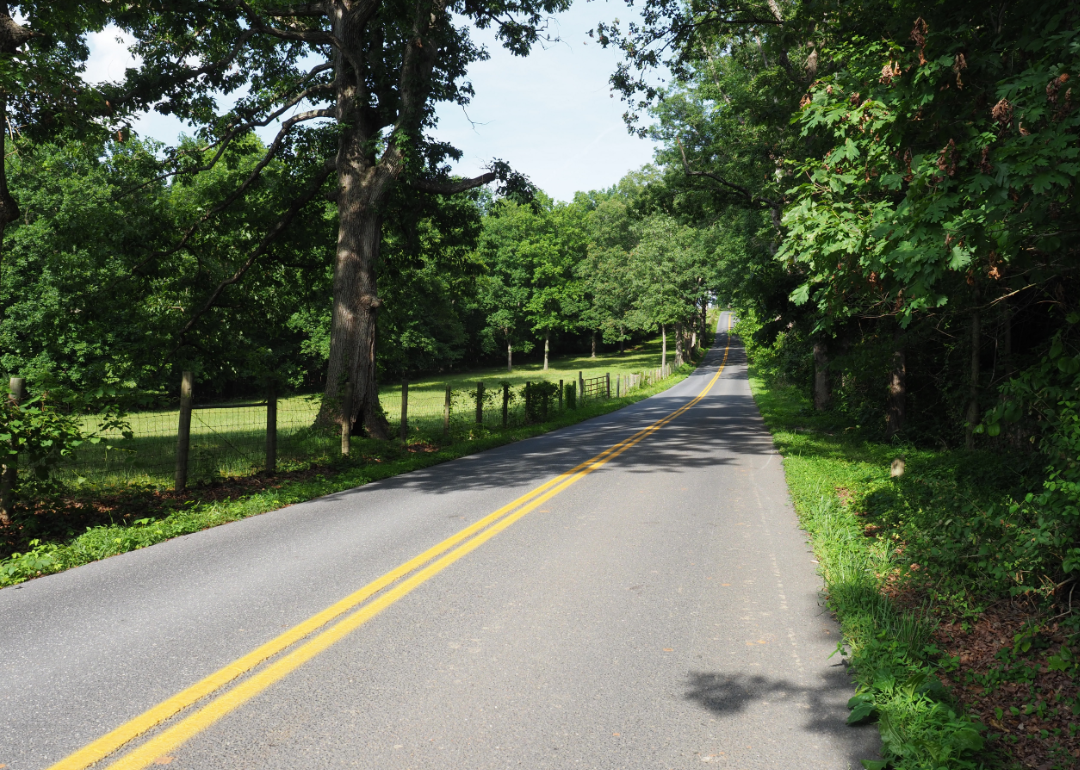
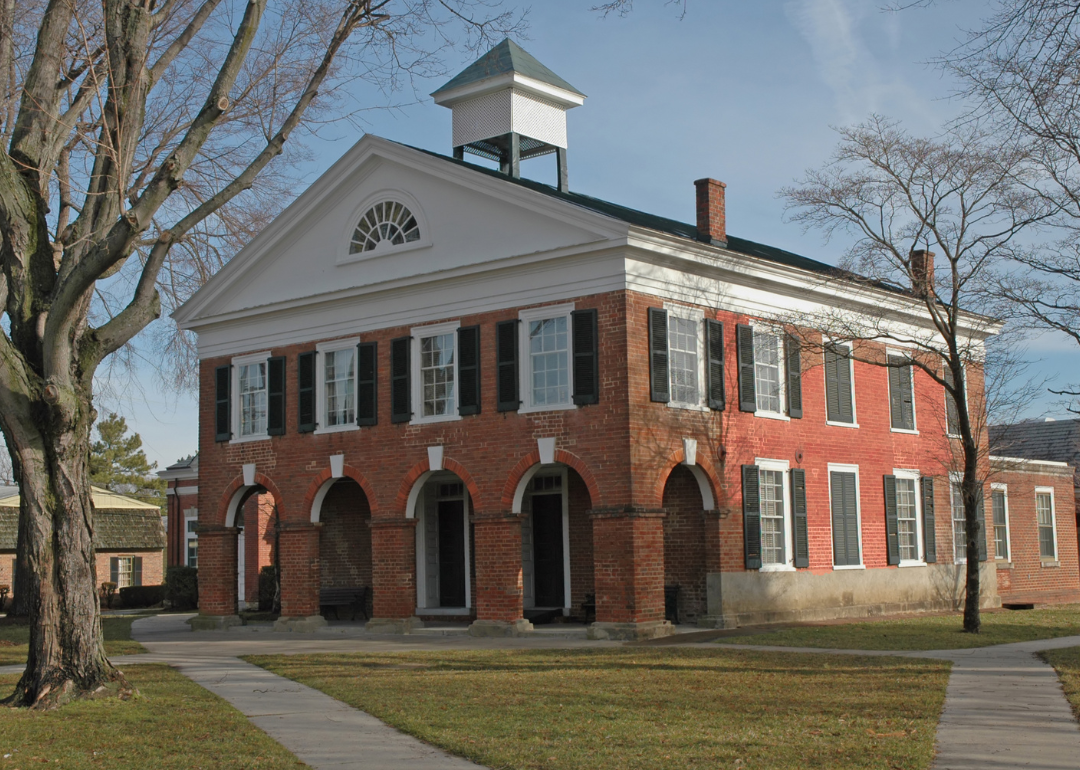
#47. Albemarle County
Canva
- Tornadoes since 2000: 7 (1.12 per 100 square miles)
- #1,706 nationally
- Tornadoes this year, as of May 31: 0
- #1,706 nationally
- Tornadoes this year, as of May 31: 0
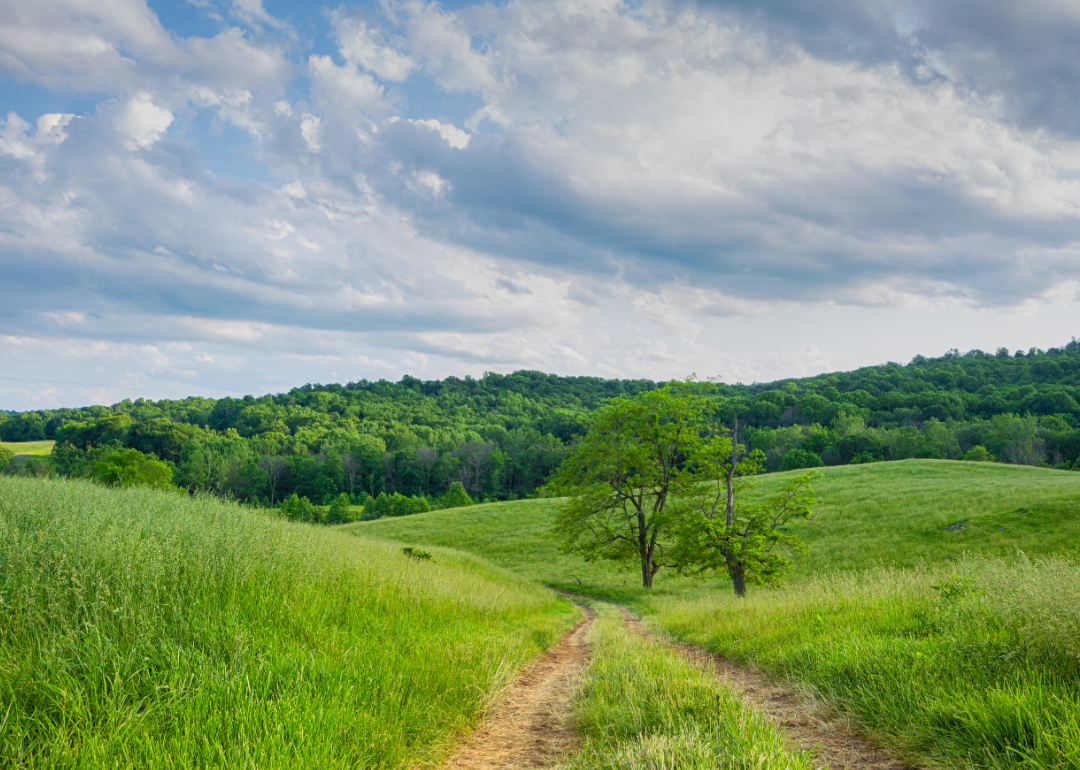
#46. Mecklenburg County

Canva
- Tornadoes since 2000: 6 (1.19 per 100 square miles)
- #1,653 nationally
- Tornadoes this year, as of May 31: 0
- #1,653 nationally
- Tornadoes this year, as of May 31: 0
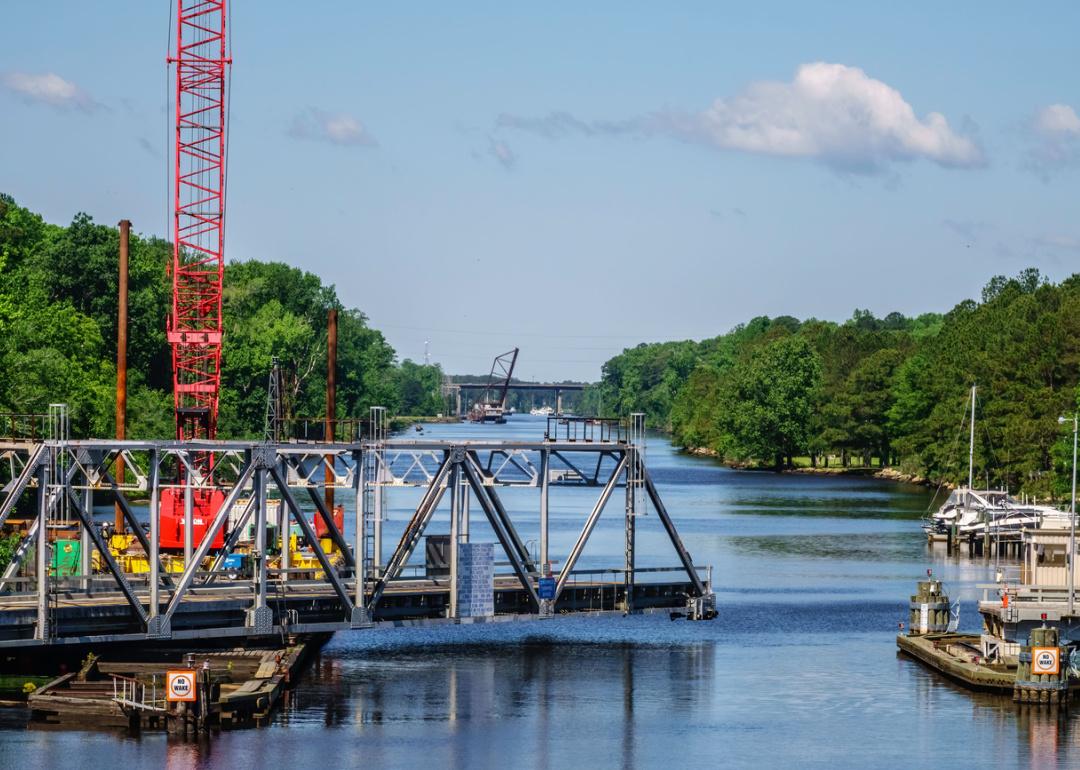
#45. Dinwiddie County

Jon Bilous // Shutterstock
- Tornadoes since 2000: 5 (1.21 per 100 square miles)
- #1,640 nationally
- Tornadoes this year, as of May 31: 0
- #1,640 nationally
- Tornadoes this year, as of May 31: 0
#44. Frederick County
Canva
- Tornadoes since 2000: 6 (1.22 per 100 square miles)
- #1,625 nationally
- Tornadoes this year, as of May 31: 0
- #1,625 nationally
- Tornadoes this year, as of May 31: 0
#43. Sussex County

Canva
- Tornadoes since 2000: 7 (1.24 per 100 square miles)
- #1,607 nationally
- Tornadoes this year, as of May 31: 0
- #1,607 nationally
- Tornadoes this year, as of May 31: 0
#42. Brunswick County
Canva
- Tornadoes since 2000: 12 (1.24 per 100 square miles)
- #1,605 nationally
- Tornadoes this year, as of May 31: 0
- #1,605 nationally
- Tornadoes this year, as of May 31: 0
#41. Pittsylvania County
Jeffery L Willis // Shutterstock
- Tornadoes since 2000: 7 (1.61 per 100 square miles)
- #1,349 nationally
- Tornadoes this year, as of May 31: 2
- #1,349 nationally
- Tornadoes this year, as of May 31: 2
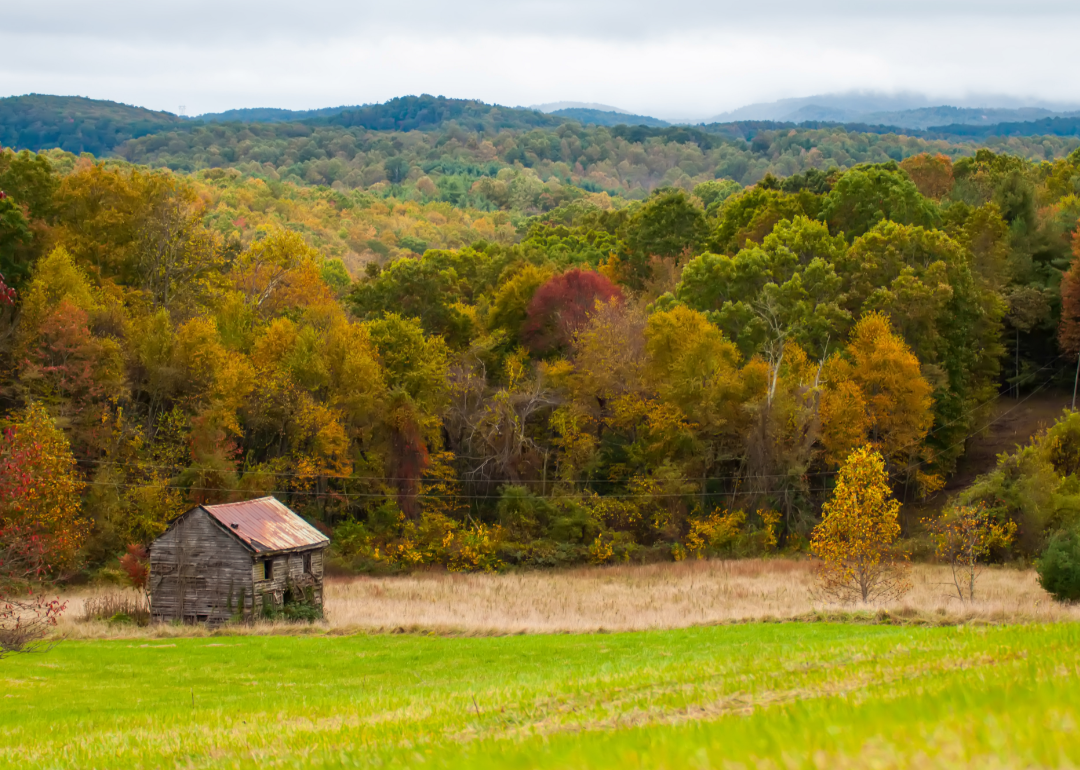
#40. Lee County
ButtermilkgirlVirginia // Shutterstock
- Tornadoes since 2000: 8 (1.61 per 100 square miles)
- #1,343 nationally
- Tornadoes this year, as of May 31: 0
- #1,343 nationally
- Tornadoes this year, as of May 31: 0
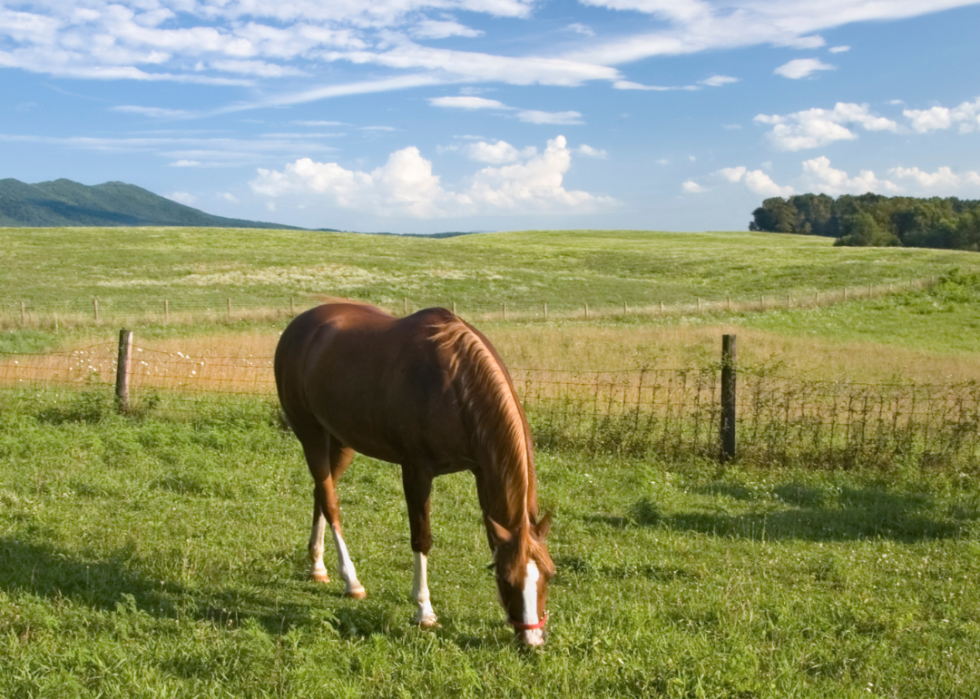
#39. Louisa County
Carolyn M Carpenter // Shutterstock
- Tornadoes since 2000: 9 (1.71 per 100 square miles)
- #1,276 nationally
- Tornadoes this year, as of May 31: 0
- #1,276 nationally
- Tornadoes this year, as of May 31: 0
#38. Caroline County

Regine Poirier // Shutterstock
- Tornadoes since 2000: 7 (1.74 per 100 square miles)
- #1,250 nationally
- Tornadoes this year, as of May 31: 0
- #1,250 nationally
- Tornadoes this year, as of May 31: 0
#37. Spotsylvania County
Ken Schulze // Shutterstock
- Tornadoes since 2000: 6 (1.76 per 100 square miles)
- #1,239 nationally
- Tornadoes this year, as of May 31: 0
- #1,239 nationally
- Tornadoes this year, as of May 31: 0
#36. Chesapeake

Canva
- Tornadoes since 2000: 9 (1.79 per 100 square miles)
- #1,218 nationally
- Tornadoes this year, as of May 31: 0
- #1,218 nationally
- Tornadoes this year, as of May 31: 0
#35. Campbell County
Lekali Studio // Shutterstock
- Tornadoes since 2000: 5 (1.89 per 100 square miles)
- #1,138 nationally
- Tornadoes this year, as of May 31: 0
- #1,138 nationally
- Tornadoes this year, as of May 31: 0
#34. Prince George County

OJUP // Shutterstock
- Tornadoes since 2000: 8 (1.89 per 100 square miles)
- #1,135 nationally
- Tornadoes this year, as of May 31: 0
- #1,135 nationally
- Tornadoes this year, as of May 31: 0
#33. Chesterfield County
Canva
- Tornadoes since 2000: 6 (1.90 per 100 square miles)
- #1,123 nationally
- Tornadoes this year, as of May 31: 0
- #1,123 nationally
- Tornadoes this year, as of May 31: 0
#32. King and Queen County

refrina // Shutterstock
- Tornadoes since 2000: 8 (2.11 per 100 square miles)
- #977 nationally
- Tornadoes this year, as of May 31: 0
- #977 nationally
- Tornadoes this year, as of May 31: 0
#31. Culpeper County

Canva
- Tornadoes since 2000: 6 (2.13 per 100 square miles)
- #964 nationally
- Tornadoes this year, as of May 31: 0
- #964 nationally
- Tornadoes this year, as of May 31: 0
#30. Goochland County

Timothy L Barnes // Shutterstock
- Tornadoes since 2000: 6 (2.15 per 100 square miles)
- #955 nationally
- Tornadoes this year, as of May 31: 0
- #955 nationally
- Tornadoes this year, as of May 31: 0
#29. Surry County
Canva
- Tornadoes since 2000: 6 (2.19 per 100 square miles)
- #936 nationally
- Tornadoes this year, as of May 31: 0
- #936 nationally
- Tornadoes this year, as of May 31: 0
#28. King William County
Don Williamson // Shutterstock
- Tornadoes since 2000: 7 (2.23 per 100 square miles)
- #906 nationally
- Tornadoes this year, as of May 31: 0
- #906 nationally
- Tornadoes this year, as of May 31: 0
#27. Nottoway County
Canva
- Tornadoes since 2000: 8 (2.25 per 100 square miles)
- #887 nationally
- Tornadoes this year, as of May 31: 0
- #887 nationally
- Tornadoes this year, as of May 31: 0
#26. Amelia County

Canva
- Tornadoes since 2000: 12 (2.33 per 100 square miles)
- #839 nationally
- Tornadoes this year, as of May 31: 0
- #839 nationally
- Tornadoes this year, as of May 31: 0
#25. Loudoun County

Canva
- Tornadoes since 2000: 14 (2.34 per 100 square miles)
- #833 nationally
- Tornadoes this year, as of May 31: 1
- #833 nationally
- Tornadoes this year, as of May 31: 1
#24. Southampton County

Kristi Blokhin // Shutterstock
- Tornadoes since 2000: 8 (2.35 per 100 square miles)
- #829 nationally
- Tornadoes this year, as of May 31: 0
- #829 nationally
- Tornadoes this year, as of May 31: 0
#23. Orange County

Wileydoc // Shutterstock
- Tornadoes since 2000: 7 (2.37 per 100 square miles)
- #813 nationally
- Tornadoes this year, as of May 31: 0
- #813 nationally
- Tornadoes this year, as of May 31: 0
#22. Greensville County
OJUP // Shutterstock
- Tornadoes since 2000: 5 (2.38 per 100 square miles)
- #800 nationally
- Tornadoes this year, as of May 31: 0
- #800 nationally
- Tornadoes this year, as of May 31: 0
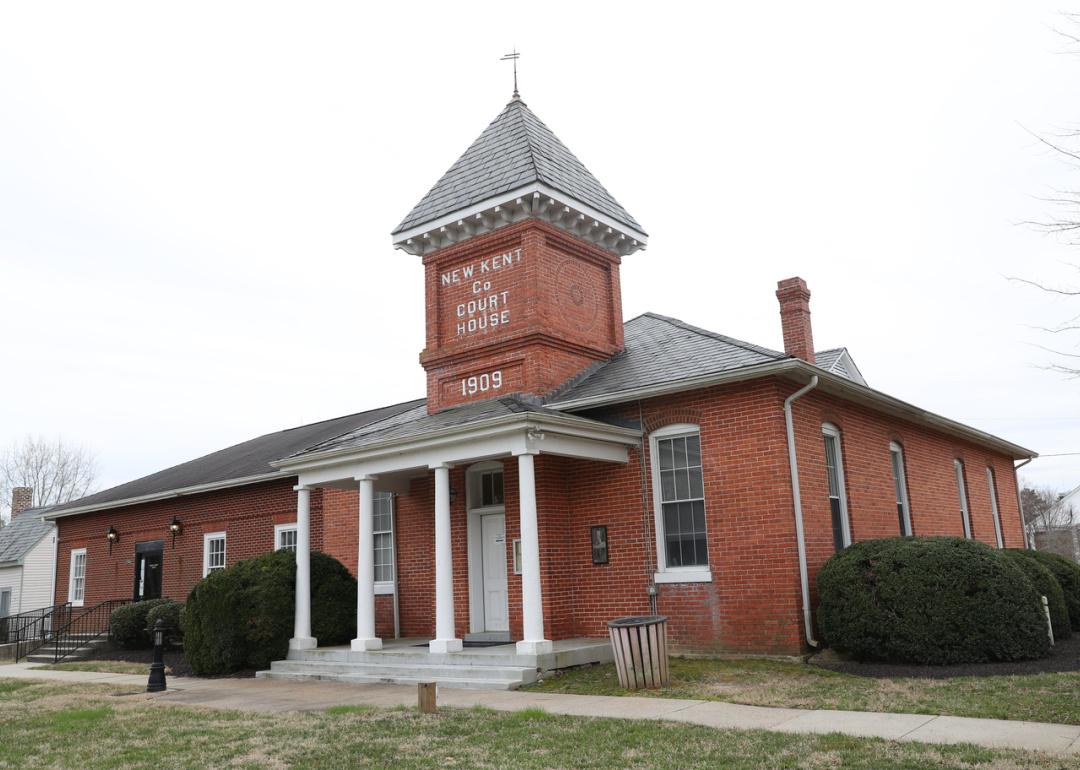
#21. New Kent County
Canva
- Tornadoes since 2000: 7 (2.45 per 100 square miles)
- #752 nationally
- Tornadoes this year, as of May 31: 0
- #752 nationally
- Tornadoes this year, as of May 31: 0
#20. Fluvanna County

Erin Cadigan // Shutterstock
- Tornadoes since 2000: 5 (2.61 per 100 square miles)
- #671 nationally
- Tornadoes this year, as of May 31: 0
- #671 nationally
- Tornadoes this year, as of May 31: 0
#19. Richmond County

Dan Kauffman // Shutterstock
- Tornadoes since 2000: 5 (2.61 per 100 square miles)
- #670 nationally
- Tornadoes this year, as of May 31: 0
- #670 nationally
- Tornadoes this year, as of May 31: 0
#18. Northumberland County

MarkVanDykePhotography // Shutterstock
- Tornadoes since 2000: 11 (2.81 per 100 square miles)
- #583 nationally
- Tornadoes this year, as of May 31: 0
- #583 nationally
- Tornadoes this year, as of May 31: 0
#17. Fairfax County

Melinda Fawver // Shutterstock
- Tornadoes since 2000: 9 (2.85 per 100 square miles)
- #565 nationally
- Tornadoes this year, as of May 31: 0
- #565 nationally
- Tornadoes this year, as of May 31: 0
#16. Isle of Wight County

Canva
- Tornadoes since 2000: 19 (2.93 per 100 square miles)
- #532 nationally
- Tornadoes this year, as of May 31: 0
- #532 nationally
- Tornadoes this year, as of May 31: 0
#15. Fauquier County

Canva
- Tornadoes since 2000: 14 (2.99 per 100 square miles)
- #499 nationally
- Tornadoes this year, as of May 31: 0
- #499 nationally
- Tornadoes this year, as of May 31: 0
#14. Hanover County

Canva
- Tornadoes since 2000: 7 (3.00 per 100 square miles)
- #495 nationally
- Tornadoes this year, as of May 31: 0
- #495 nationally
- Tornadoes this year, as of May 31: 0
#13. Henrico County

Sherry V Smith // Shutterstock
- Tornadoes since 2000: 8 (3.21 per 100 square miles)
- #411 nationally
- Tornadoes this year, as of May 31: 1
- #411 nationally
- Tornadoes this year, as of May 31: 1
#12. Virginia Beach

Barry Blackburn // Shutterstock
- Tornadoes since 2000: 7 (3.21 per 100 square miles)
- #410 nationally
- Tornadoes this year, as of May 31: 0
- #410 nationally
- Tornadoes this year, as of May 31: 0
#11. Gloucester County

O.C Ritz // Shutterstock
- Tornadoes since 2000: 14 (3.50 per 100 square miles)
- #325 nationally
- Tornadoes this year, as of May 31: 0
- #325 nationally
- Tornadoes this year, as of May 31: 0
#10. Suffolk

Canva
- Tornadoes since 2000: 12 (3.57 per 100 square miles)
- #307 nationally
- Tornadoes this year, as of May 31: 0
- #307 nationally
- Tornadoes this year, as of May 31: 0
#9. Prince William County

Canva
- Tornadoes since 2000: 7 (3.90 per 100 square miles)
- #248 nationally
- Tornadoes this year, as of May 31: 0
- #248 nationally
- Tornadoes this year, as of May 31: 0
#8. King George County

Felix Lipov // Shutterstock
- Tornadoes since 2000: 11 (4.09 per 100 square miles)
- #218 nationally
- Tornadoes this year, as of May 31: 0
- #218 nationally
- Tornadoes this year, as of May 31: 0
#7. Stafford County

Canva
- Tornadoes since 2000: 7 (4.91 per 100 square miles)
- #114 nationally
- Tornadoes this year, as of May 31: 0
- #114 nationally
- Tornadoes this year, as of May 31: 0
#6. James City County
Canva
- Tornadoes since 2000: 7 (5.25 per 100 square miles)
- #91 nationally
- Tornadoes this year, as of May 31: 0
- #91 nationally
- Tornadoes this year, as of May 31: 0
#5. Lancaster County
EchoFree // Shutterstock
- Tornadoes since 2000: 7 (5.37 per 100 square miles)
- #83 nationally
- Tornadoes this year, as of May 31: 0
- #83 nationally
- Tornadoes this year, as of May 31: 0
#4. Middlesex County
Canva
- Tornadoes since 2000: 6 (5.73 per 100 square miles)
- #65 nationally
- Tornadoes this year, as of May 31: 0
- #65 nationally
- Tornadoes this year, as of May 31: 0
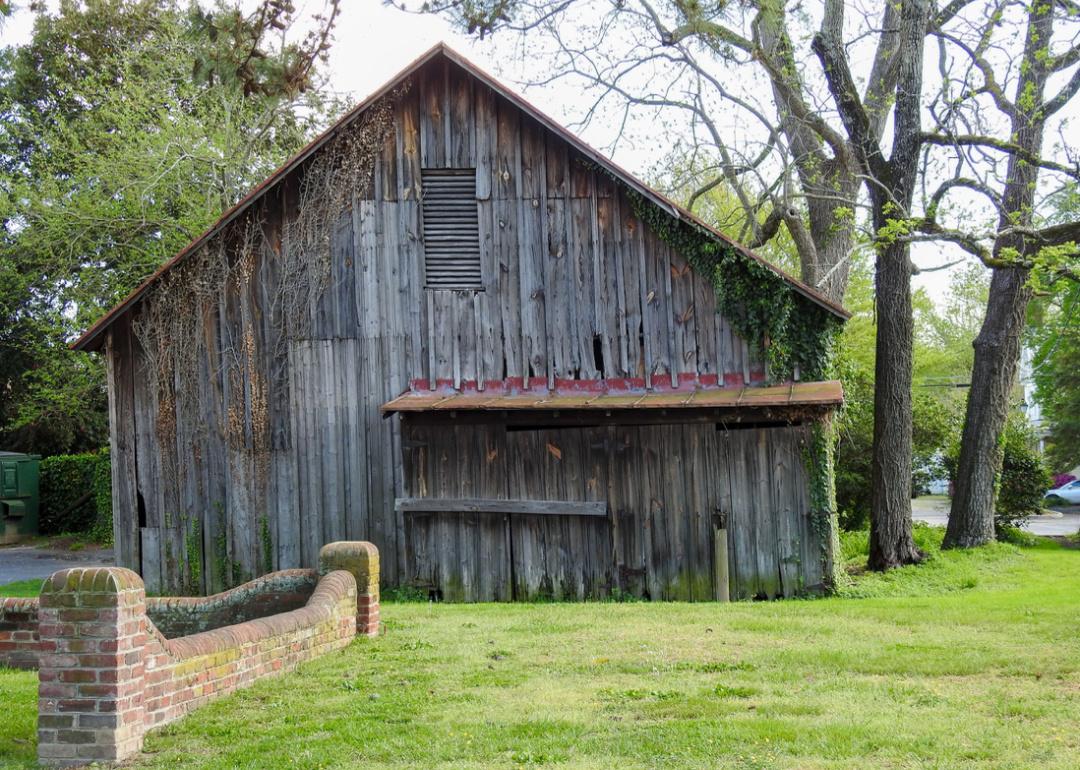
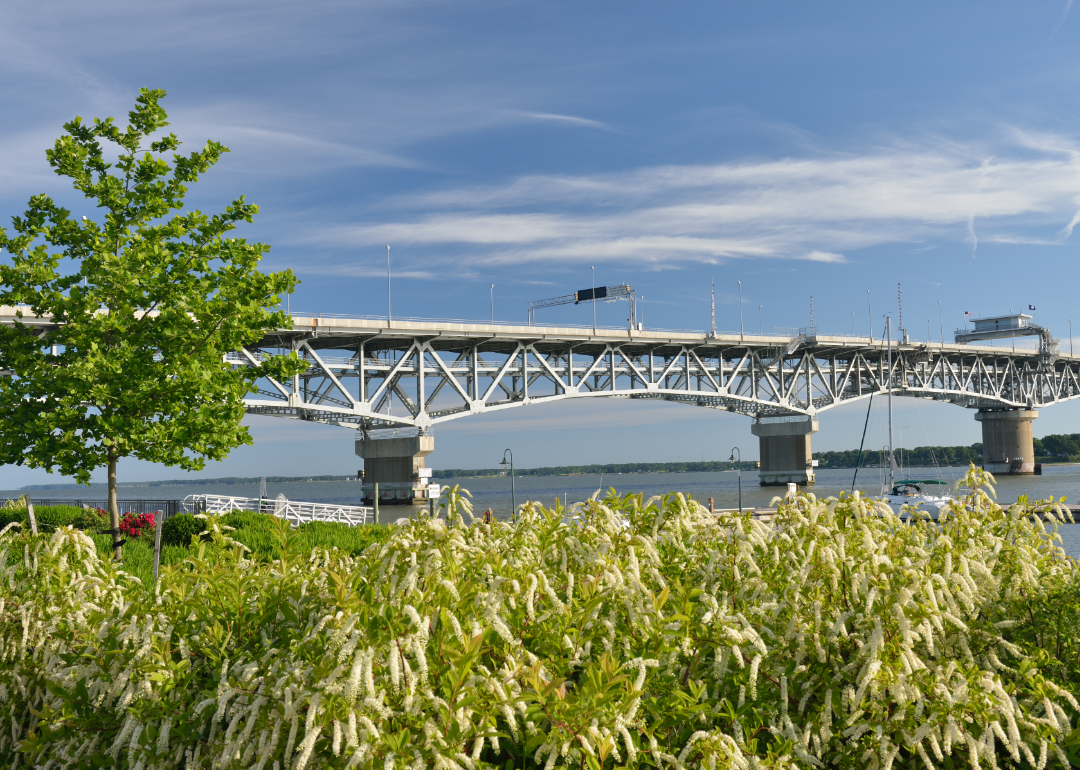
#3. York County
Canva
- Tornadoes since 2000: 5 (5.82 per 100 square miles)
- #58 nationally
- Tornadoes this year, as of May 31: 0
- #58 nationally
- Tornadoes this year, as of May 31: 0
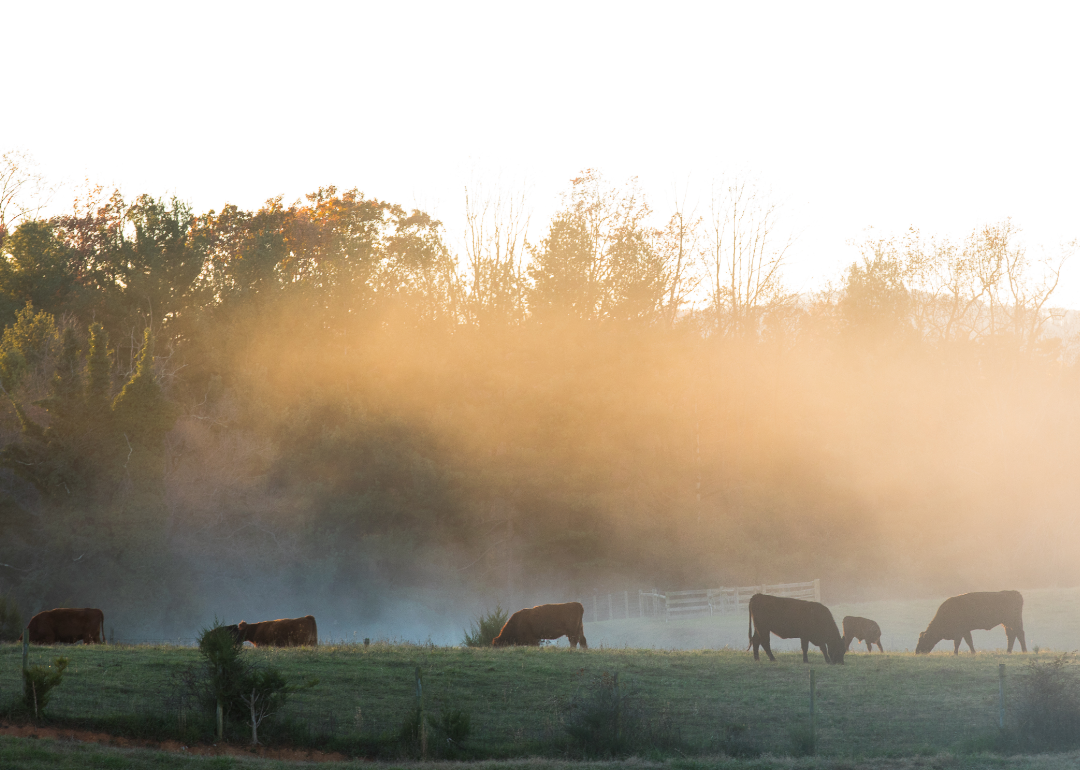
#2. Mathews County
Erin Cadigan // Shutterstock
- Tornadoes since 2000: 9 (15.05 per 100 square miles)
- #1 nationally
- Tornadoes this year, as of May 31: 0
- #1 nationally
- Tornadoes this year, as of May 31: 0
#1. Richmond
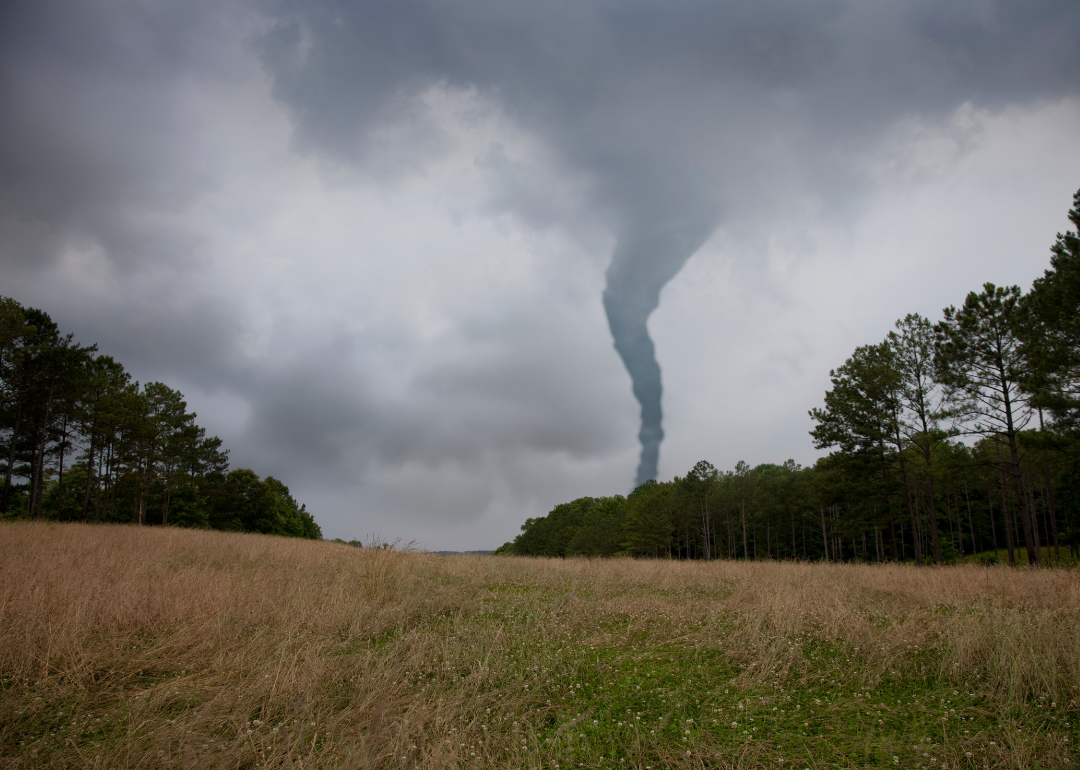
Canva