Counties with the highest rates of high blood pressure in Washington
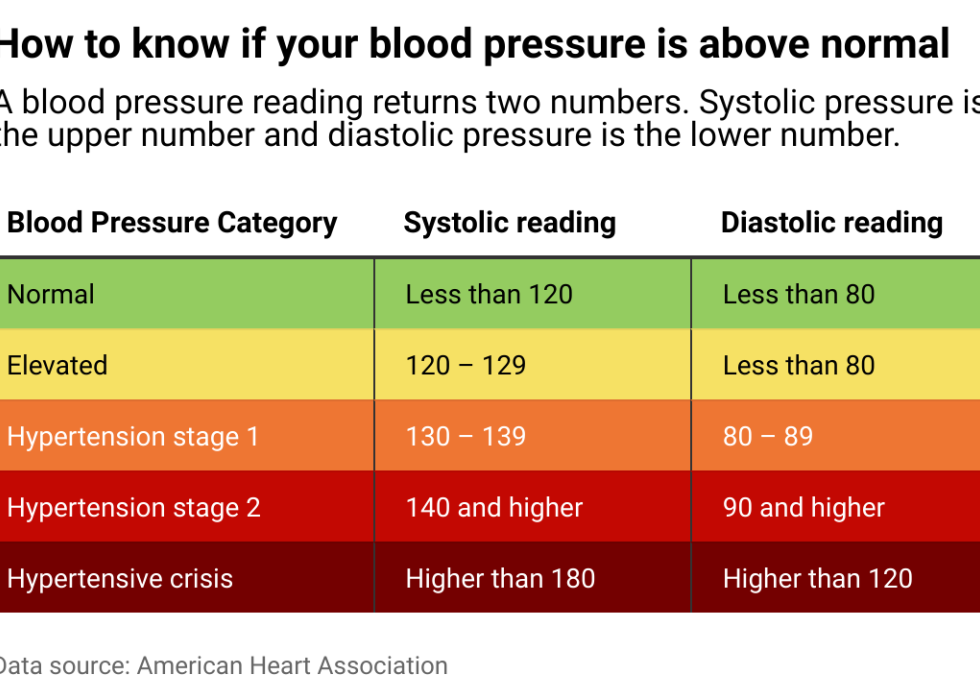
The American Heart Association and the American College of Cardiology in 2017 updated high blood pressure guidelines for the first time since 2003. Any reading of 130/80 and above is now considered hypertensive.
Blood pressure is measured using two numbers: systolic and diastolic pressure. The systolic reading examines the arteries when the heart is beating, while the diastolic reading examines them while the heart rests. Normal blood pressure is below 120/80.
Diet is a major driver of high blood pressure, with salty foods and low-potassium diets connected to hypertension. Other lifestyle choices play a part, too, including drinking and smoking. The CDC says heredity also likely plays some role in hypertension risk.
For people who have hypertension, limiting high-risk foods and behaviors, taking medication recommended by doctors, and regularly monitoring their blood pressure with a cuff can prevent more severe incidents.
Read on to see the counties in Washington with the highest rates of hypertension.

- Adults with high blood pressure: 27.6%
- Adults on medication for high blood pressure: 14.5% (52.4% of those with high blood pressure)
- Adults with high blood pressure: 27.9%
- Adults on medication for high blood pressure: 14.5% (52.0% of those with high blood pressure)

- Adults with high blood pressure: 28.1%
- Adults on medication for high blood pressure: 14.6% (51.8% of those with high blood pressure)

- Adults with high blood pressure: 28.2%
- Adults on medication for high blood pressure: 14.7% (52.1% of those with high blood pressure)
- Adults with high blood pressure: 28.2%
- Adults on medication for high blood pressure: 14.7% (52.3% of those with high blood pressure)
- Adults with high blood pressure: 28.3%
- Adults on medication for high blood pressure: 14.4% (50.9% of those with high blood pressure)

- Adults with high blood pressure: 28.3%
- Adults on medication for high blood pressure: 15.1% (53.3% of those with high blood pressure)
- Adults with high blood pressure: 28.4%
- Adults on medication for high blood pressure: 14.7% (51.6% of those with high blood pressure)

- Adults with high blood pressure: 28.4%
- Adults on medication for high blood pressure: 14.7% (51.9% of those with high blood pressure)

- Adults with high blood pressure: 28.6%
- Adults on medication for high blood pressure: 14.4% (50.5% of those with high blood pressure)

- Adults with high blood pressure: 28.8%
- Adults on medication for high blood pressure: 14.8% (51.5% of those with high blood pressure)

- Adults with high blood pressure: 29.0%
- Adults on medication for high blood pressure: 14.8% (50.9% of those with high blood pressure)

- Adults with high blood pressure: 29.1%
- Adults on medication for high blood pressure: 15.1% (51.9% of those with high blood pressure)
- Adults with high blood pressure: 29.1%
- Adults on medication for high blood pressure: 15.3% (52.6% of those with high blood pressure)
- Adults with high blood pressure: 29.5%
- Adults on medication for high blood pressure: 15.3% (51.7% of those with high blood pressure)

- Adults with high blood pressure: 29.6%
- Adults on medication for high blood pressure: 15.8% (53.3% of those with high blood pressure)

- Adults with high blood pressure: 29.8%
- Adults on medication for high blood pressure: 15.2% (50.9% of those with high blood pressure)

- Adults with high blood pressure: 30.3%
- Adults on medication for high blood pressure: 15.7% (51.8% of those with high blood pressure)

- Adults with high blood pressure: 30.4%
- Adults on medication for high blood pressure: 16.3% (53.5% of those with high blood pressure)

- Adults with high blood pressure: 30.5%
- Adults on medication for high blood pressure: 16.0% (52.5% of those with high blood pressure)

- Adults with high blood pressure: 30.7%
- Adults on medication for high blood pressure: 16.0% (52.0% of those with high blood pressure)
- Adults with high blood pressure: 30.7%
- Adults on medication for high blood pressure: 16.3% (53.1% of those with high blood pressure)

- Adults with high blood pressure: 30.8%
- Adults on medication for high blood pressure: 15.6% (50.5% of those with high blood pressure)

- Adults with high blood pressure: 30.9%
- Adults on medication for high blood pressure: 16.2% (52.3% of those with high blood pressure)

- Adults with high blood pressure: 31.9%
- Adults on medication for high blood pressure: 16.7% (52.4% of those with high blood pressure)
This story features data reporting and writing by Emma Rubin and is part of a series utilizing data automation across 49 states.