Counties with the highest rates of strokes in Washington

kan_khampanya // Shutterstock
- Age-adjusted rate of all strokes among adults, estimates for 2021: 2.3% (range between 2.0% and 2.6%)
- Death rate for ischemic strokes, 2018-20: 13.8 per 100K people
- Death rate for hemorrhagic strokes, 2018-20: 6.7 per 100K people
- Death rate for ischemic strokes, 2018-20: 13.8 per 100K people
- Death rate for hemorrhagic strokes, 2018-20: 6.7 per 100K people
#39. King County

Canva
- Age-adjusted rate of all strokes among adults, estimates for 2021: 2.4% (range between 2.1% and 2.7%)
- Death rate for ischemic strokes, 2018-20: 16.2 per 100K people
- Death rate for hemorrhagic strokes, 2018-20: 9.1 per 100K people
- Death rate for ischemic strokes, 2018-20: 16.2 per 100K people
- Death rate for hemorrhagic strokes, 2018-20: 9.1 per 100K people
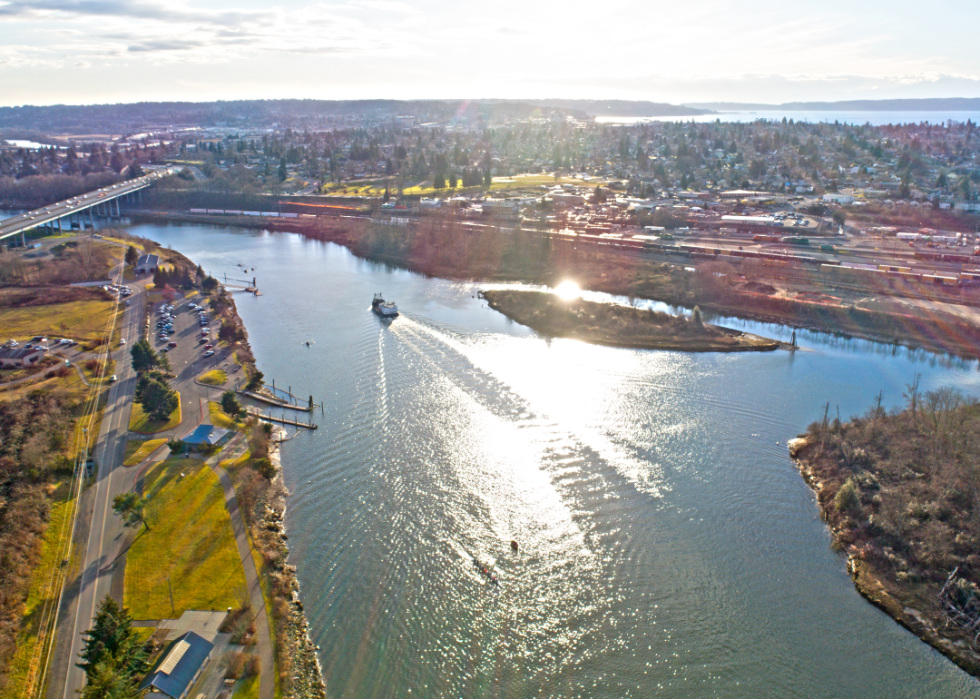
#38. San Juan County
Canva
- Age-adjusted rate of all strokes among adults, estimates for 2021: 2.5% (range between 2.2% and 2.8%)
- Death rate for ischemic strokes, 2018-20: 14.7 per 100K people
- Death rate for hemorrhagic strokes, 2018-20: 7.8 per 100K people
- Death rate for ischemic strokes, 2018-20: 14.7 per 100K people
- Death rate for hemorrhagic strokes, 2018-20: 7.8 per 100K people
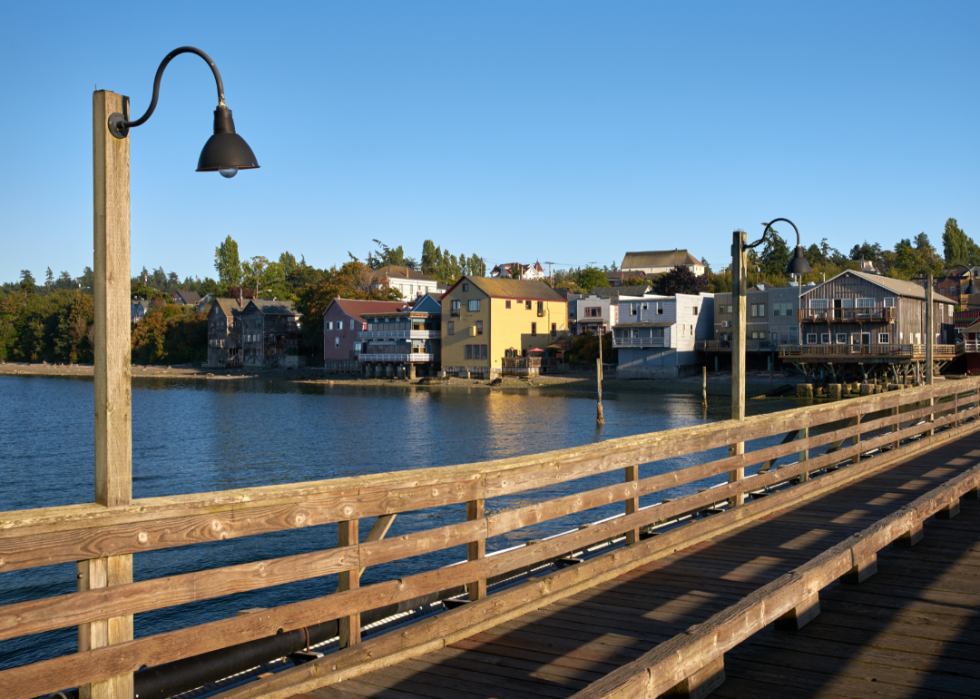
#37. Snohomish County
Canva
- Age-adjusted rate of all strokes among adults, estimates for 2021: 2.5% (range between 2.2% and 2.8%)
- Death rate for ischemic strokes, 2018-20: 14.9 per 100K people
- Death rate for hemorrhagic strokes, 2018-20: 8.2 per 100K people
- Death rate for ischemic strokes, 2018-20: 14.9 per 100K people
- Death rate for hemorrhagic strokes, 2018-20: 8.2 per 100K people
#36. Island County

Canva
- Age-adjusted rate of all strokes among adults, estimates for 2021: 2.5% (range between 2.2% and 2.9%)
- Death rate for ischemic strokes, 2018-20: 18.4 per 100K people
- Death rate for hemorrhagic strokes, 2018-20: 9.9 per 100K people
- Death rate for ischemic strokes, 2018-20: 18.4 per 100K people
- Death rate for hemorrhagic strokes, 2018-20: 9.9 per 100K people
You may also like: Highest-earning cities in Washington
#35. Kitsap County

Canva
- Age-adjusted rate of all strokes among adults, estimates for 2021: 2.5% (range between 2.2% and 2.9%)
- Death rate for ischemic strokes, 2018-20: 21.3 per 100K people
- Death rate for hemorrhagic strokes, 2018-20: 8.0 per 100K people
- Death rate for ischemic strokes, 2018-20: 21.3 per 100K people
- Death rate for hemorrhagic strokes, 2018-20: 8.0 per 100K people
#34. Jefferson County

Canva
- Age-adjusted rate of all strokes among adults, estimates for 2021: 2.6% (range between 2.3% and 2.9%)
- Death rate for ischemic strokes, 2018-20: 14.9 per 100K people
- Death rate for hemorrhagic strokes, 2018-20: 8.5 per 100K people
- Death rate for ischemic strokes, 2018-20: 14.9 per 100K people
- Death rate for hemorrhagic strokes, 2018-20: 8.5 per 100K people
#33. Clark County

Victoria Ditkovsky // Shutterstock
- Age-adjusted rate of all strokes among adults, estimates for 2021: 2.6% (range between 2.3% and 3.0%)
- Death rate for ischemic strokes, 2018-20: 17.7 per 100K people
- Death rate for hemorrhagic strokes, 2018-20: 9.4 per 100K people
- Death rate for ischemic strokes, 2018-20: 17.7 per 100K people
- Death rate for hemorrhagic strokes, 2018-20: 9.4 per 100K people
#32. Benton County

Canva
- Age-adjusted rate of all strokes among adults, estimates for 2021: 2.6% (range between 2.2% and 2.9%)
- Death rate for ischemic strokes, 2018-20: 19.1 per 100K people
- Death rate for hemorrhagic strokes, 2018-20: 9.9 per 100K people
- Death rate for ischemic strokes, 2018-20: 19.1 per 100K people
- Death rate for hemorrhagic strokes, 2018-20: 9.9 per 100K people
#31. Thurston County

Canva
- Age-adjusted rate of all strokes among adults, estimates for 2021: 2.6% (range between 2.3% and 3.0%)
- Death rate for ischemic strokes, 2018-20: 20.4 per 100K people
- Death rate for hemorrhagic strokes, 2018-20: 8.3 per 100K people
- Death rate for ischemic strokes, 2018-20: 20.4 per 100K people
- Death rate for hemorrhagic strokes, 2018-20: 8.3 per 100K people
You may also like: Extreme heat: How climate change has affected Washington
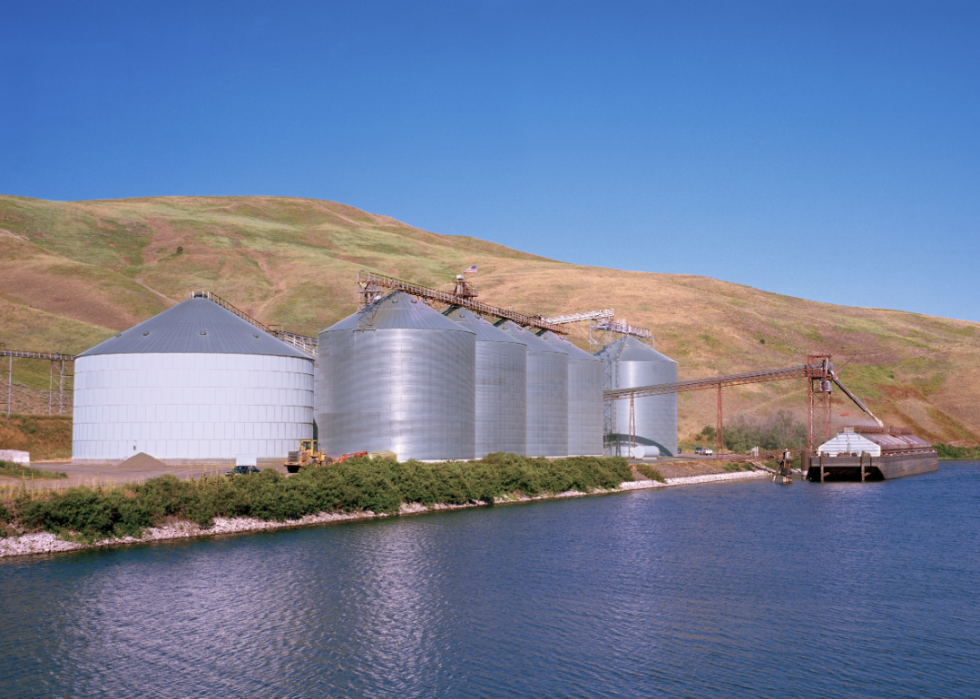
#30. Skagit County
Canva
- Age-adjusted rate of all strokes among adults, estimates for 2021: 2.6% (range between 2.3% and 3.0%)
- Death rate for ischemic strokes, 2018-20: 21.4 per 100K people
- Death rate for hemorrhagic strokes, 2018-20: 6.6 per 100K people
- Death rate for ischemic strokes, 2018-20: 21.4 per 100K people
- Death rate for hemorrhagic strokes, 2018-20: 6.6 per 100K people
#29. Garfield County

Canva
- Age-adjusted rate of all strokes among adults, estimates for 2021: 2.7% (range between 2.4% and 3.1%)
- Death rate for ischemic strokes, 2018-20: 16.4 per 100K people
- Death rate for hemorrhagic strokes, 2018-20: 8.5 per 100K people
- Death rate for ischemic strokes, 2018-20: 16.4 per 100K people
- Death rate for hemorrhagic strokes, 2018-20: 8.5 per 100K people
#28. Skamania County

Canva
- Age-adjusted rate of all strokes among adults, estimates for 2021: 2.7% (range between 2.4% and 3.0%)
- Death rate for ischemic strokes, 2018-20: 18.1 per 100K people
- Death rate for hemorrhagic strokes, 2018-20: 9.9 per 100K people
- Death rate for ischemic strokes, 2018-20: 18.1 per 100K people
- Death rate for hemorrhagic strokes, 2018-20: 9.9 per 100K people
#27. Pierce County

Canva
- Age-adjusted rate of all strokes among adults, estimates for 2021: 2.7% (range between 2.3% and 3.0%)
- Death rate for ischemic strokes, 2018-20: 18.4 per 100K people
- Death rate for hemorrhagic strokes, 2018-20: 8.9 per 100K people
- Death rate for ischemic strokes, 2018-20: 18.4 per 100K people
- Death rate for hemorrhagic strokes, 2018-20: 8.9 per 100K people
#26. Whatcom County

Canva
- Age-adjusted rate of all strokes among adults, estimates for 2021: 2.7% (range between 2.4% and 3.0%)
- Death rate for ischemic strokes, 2018-20: 19.9 per 100K people
- Death rate for hemorrhagic strokes, 2018-20: 7.4 per 100K people
- Death rate for ischemic strokes, 2018-20: 19.9 per 100K people
- Death rate for hemorrhagic strokes, 2018-20: 7.4 per 100K people
You may also like: Highest-rated football recruits from Washington over the last 20 years
#25. Spokane County

davidrh // Shutterstock
- Age-adjusted rate of all strokes among adults, estimates for 2021: 2.7% (range between 2.4% and 3.1%)
- Death rate for ischemic strokes, 2018-20: 20.7 per 100K people
- Death rate for hemorrhagic strokes, 2018-20: 8.5 per 100K people
- Death rate for ischemic strokes, 2018-20: 20.7 per 100K people
- Death rate for hemorrhagic strokes, 2018-20: 8.5 per 100K people
#24. Columbia County

Canva
- Age-adjusted rate of all strokes among adults, estimates for 2021: 2.8% (range between 2.4% and 3.2%)
- Death rate for ischemic strokes, 2018-20: 15.0 per 100K people
- Death rate for hemorrhagic strokes, 2018-20: 6.9 per 100K people
- Death rate for ischemic strokes, 2018-20: 15.0 per 100K people
- Death rate for hemorrhagic strokes, 2018-20: 6.9 per 100K people
#23. Chelan County

Canva
- Age-adjusted rate of all strokes among adults, estimates for 2021: 2.8% (range between 2.5% and 3.2%)
- Death rate for ischemic strokes, 2018-20: 17.2 per 100K people
- Death rate for hemorrhagic strokes, 2018-20: 8.3 per 100K people
- Death rate for ischemic strokes, 2018-20: 17.2 per 100K people
- Death rate for hemorrhagic strokes, 2018-20: 8.3 per 100K people
#22. Douglas County

Canva
- Age-adjusted rate of all strokes among adults, estimates for 2021: 2.8% (range between 2.4% and 3.1%)
- Death rate for ischemic strokes, 2018-20: 17.7 per 100K people
- Death rate for hemorrhagic strokes, 2018-20: 8.0 per 100K people
- Death rate for ischemic strokes, 2018-20: 17.7 per 100K people
- Death rate for hemorrhagic strokes, 2018-20: 8.0 per 100K people
#21. Kittitas County
Canva
- Age-adjusted rate of all strokes among adults, estimates for 2021: 2.8% (range between 2.4% and 3.1%)
- Death rate for ischemic strokes, 2018-20: 19.2 per 100K people
- Death rate for hemorrhagic strokes, 2018-20: 9.2 per 100K people
- Death rate for ischemic strokes, 2018-20: 19.2 per 100K people
- Death rate for hemorrhagic strokes, 2018-20: 9.2 per 100K people
You may also like: Counties with the lowest hospital bed capacity in Washington
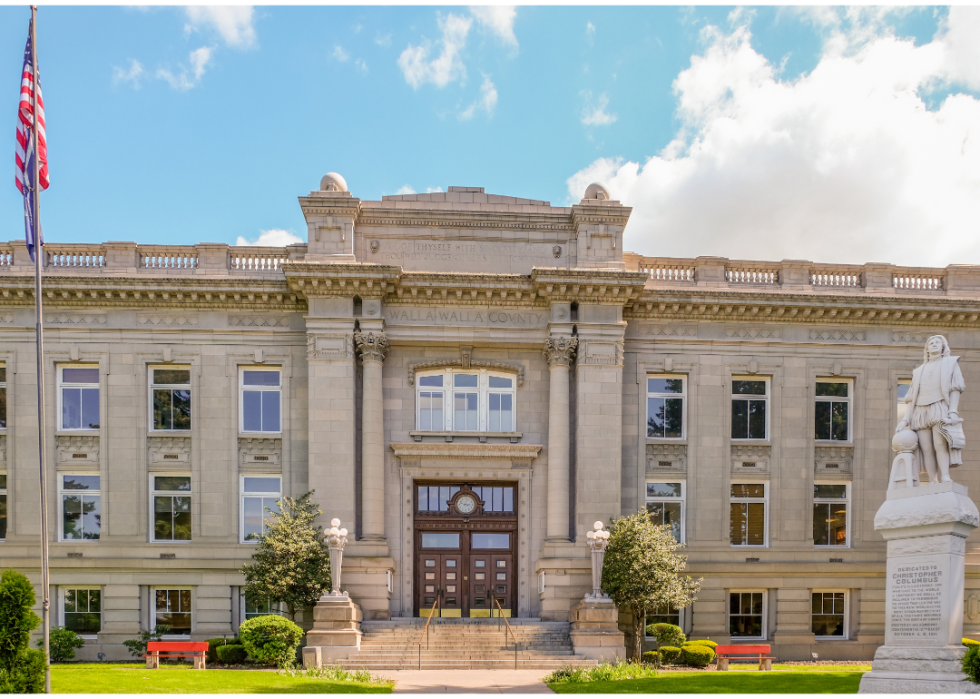
#20. Walla Walla County

Canva
- Age-adjusted rate of all strokes among adults, estimates for 2021: 2.8% (range between 2.5% and 3.2%)
- Death rate for ischemic strokes, 2018-20: 19.4 per 100K people
- Death rate for hemorrhagic strokes, 2018-20: 7.6 per 100K people
- Death rate for ischemic strokes, 2018-20: 19.4 per 100K people
- Death rate for hemorrhagic strokes, 2018-20: 7.6 per 100K people
#19. Pend Oreille County

Arpad Jasko // Shutterstock
- Age-adjusted rate of all strokes among adults, estimates for 2021: 2.8% (range between 2.4% and 3.2%)
- Death rate for ischemic strokes, 2018-20: 19.5 per 100K people
- Death rate for hemorrhagic strokes, 2018-20: 7.9 per 100K people
- Death rate for ischemic strokes, 2018-20: 19.5 per 100K people
- Death rate for hemorrhagic strokes, 2018-20: 7.9 per 100K people
#18. Lincoln County

Canva
- Age-adjusted rate of all strokes among adults, estimates for 2021: 2.8% (range between 2.5% and 3.2%)
- Death rate for ischemic strokes, 2018-20: 20.5 per 100K people
- Death rate for hemorrhagic strokes, 2018-20: 8.9 per 100K people
- Death rate for ischemic strokes, 2018-20: 20.5 per 100K people
- Death rate for hemorrhagic strokes, 2018-20: 8.9 per 100K people
#17. Wahkiakum County

Canva
- Age-adjusted rate of all strokes among adults, estimates for 2021: 2.8% (range between 2.4% and 3.1%)
- Death rate for ischemic strokes, 2018-20: 20.6 per 100K people
- Death rate for hemorrhagic strokes, 2018-20: 7.7 per 100K people
- Death rate for ischemic strokes, 2018-20: 20.6 per 100K people
- Death rate for hemorrhagic strokes, 2018-20: 7.7 per 100K people
#16. Clallam County

Canva
- Age-adjusted rate of all strokes among adults, estimates for 2021: 2.9% (range between 2.5% and 3.3%)
- Death rate for ischemic strokes, 2018-20: 17.2 per 100K people
- Death rate for hemorrhagic strokes, 2018-20: 8.7 per 100K people
- Death rate for ischemic strokes, 2018-20: 17.2 per 100K people
- Death rate for hemorrhagic strokes, 2018-20: 8.7 per 100K people
You may also like: Counties with the highest rate of food insecurity in Washington
#15. Klickitat County

Canva
- Age-adjusted rate of all strokes among adults, estimates for 2021: 2.9% (range between 2.6% and 3.3%)
- Death rate for ischemic strokes, 2018-20: 18.6 per 100K people
- Death rate for hemorrhagic strokes, 2018-20: 9.9 per 100K people
- Death rate for ischemic strokes, 2018-20: 18.6 per 100K people
- Death rate for hemorrhagic strokes, 2018-20: 9.9 per 100K people
#14. Mason County

Canva
- Age-adjusted rate of all strokes among adults, estimates for 2021: 2.9% (range between 2.6% and 3.4%)
- Death rate for ischemic strokes, 2018-20: 18.7 per 100K people
- Death rate for hemorrhagic strokes, 2018-20: 7.6 per 100K people
- Death rate for ischemic strokes, 2018-20: 18.7 per 100K people
- Death rate for hemorrhagic strokes, 2018-20: 7.6 per 100K people
#13. Stevens County

davidrh // Shutterstock
- Age-adjusted rate of all strokes among adults, estimates for 2021: 2.9% (range between 2.6% and 3.4%)
- Death rate for ischemic strokes, 2018-20: 20.1 per 100K people
- Death rate for hemorrhagic strokes, 2018-20: 9.8 per 100K people
- Death rate for ischemic strokes, 2018-20: 20.1 per 100K people
- Death rate for hemorrhagic strokes, 2018-20: 9.8 per 100K people
#12. Lewis County

Canva
- Age-adjusted rate of all strokes among adults, estimates for 2021: 2.9% (range between 2.6% and 3.3%)
- Death rate for ischemic strokes, 2018-20: 20.5 per 100K people
- Death rate for hemorrhagic strokes, 2018-20: 6.1 per 100K people
- Death rate for ischemic strokes, 2018-20: 20.5 per 100K people
- Death rate for hemorrhagic strokes, 2018-20: 6.1 per 100K people
#11. Asotin County

Canva
- Age-adjusted rate of all strokes among adults, estimates for 2021: 2.9% (range between 2.5% and 3.3%)
- Death rate for ischemic strokes, 2018-20: 21.6 per 100K people
- Death rate for hemorrhagic strokes, 2018-20: 8.2 per 100K people
- Death rate for ischemic strokes, 2018-20: 21.6 per 100K people
- Death rate for hemorrhagic strokes, 2018-20: 8.2 per 100K people
You may also like: Famous actors from Washington
#10. Cowlitz County

Canva
- Age-adjusted rate of all strokes among adults, estimates for 2021: 2.9% (range between 2.5% and 3.2%)
- Death rate for ischemic strokes, 2018-20: 22.3 per 100K people
- Death rate for hemorrhagic strokes, 2018-20: 9.3 per 100K people
- Death rate for ischemic strokes, 2018-20: 22.3 per 100K people
- Death rate for hemorrhagic strokes, 2018-20: 9.3 per 100K people
#9. Pacific County

Canva
- Age-adjusted rate of all strokes among adults, estimates for 2021: 3.0% (range between 2.6% and 3.3%)
- Death rate for ischemic strokes, 2018-20: 19.9 per 100K people
- Death rate for hemorrhagic strokes, 2018-20: 7.5 per 100K people
- Death rate for ischemic strokes, 2018-20: 19.9 per 100K people
- Death rate for hemorrhagic strokes, 2018-20: 7.5 per 100K people
#8. Whitman County

Irra // Shutterstock
- Age-adjusted rate of all strokes among adults, estimates for 2021: 3.1% (range between 2.7% and 3.5%)
- Death rate for ischemic strokes, 2018-20: 18.6 per 100K people
- Death rate for hemorrhagic strokes, 2018-20: 9.8 per 100K people
- Death rate for ischemic strokes, 2018-20: 18.6 per 100K people
- Death rate for hemorrhagic strokes, 2018-20: 9.8 per 100K people
#7. Grant County
davidrh // Shutterstock
- Age-adjusted rate of all strokes among adults, estimates for 2021: 3.1% (range between 2.7% and 3.5%)
- Death rate for ischemic strokes, 2018-20: 19.8 per 100K people
- Death rate for hemorrhagic strokes, 2018-20: 8.6 per 100K people
- Death rate for ischemic strokes, 2018-20: 19.8 per 100K people
- Death rate for hemorrhagic strokes, 2018-20: 8.6 per 100K people
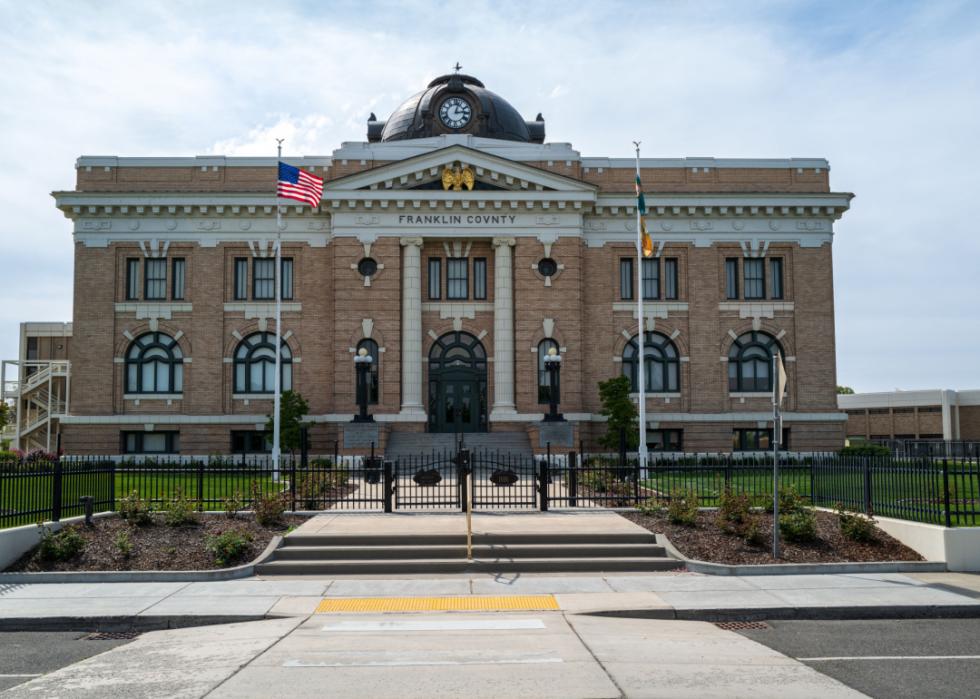
#6. Franklin County

seesaw1 // Shutterstock
- Age-adjusted rate of all strokes among adults, estimates for 2021: 3.1% (range between 2.7% and 3.5%)
- Death rate for ischemic strokes, 2018-20: 20.0 per 100K people
- Death rate for hemorrhagic strokes, 2018-20: 9.1 per 100K people
- Death rate for ischemic strokes, 2018-20: 20.0 per 100K people
- Death rate for hemorrhagic strokes, 2018-20: 9.1 per 100K people
You may also like: Best community colleges in Washington
#5. Grays Harbor County

Canva
- Age-adjusted rate of all strokes among adults, estimates for 2021: 3.3% (range between 2.9% and 3.7%)
- Death rate for ischemic strokes, 2018-20: 16.6 per 100K people
- Death rate for hemorrhagic strokes, 2018-20: 9.4 per 100K people
- Death rate for ischemic strokes, 2018-20: 16.6 per 100K people
- Death rate for hemorrhagic strokes, 2018-20: 9.4 per 100K people
#4. Yakima County

Canva
- Age-adjusted rate of all strokes among adults, estimates for 2021: 3.3% (range between 3.0% and 3.8%)
- Death rate for ischemic strokes, 2018-20: 19.8 per 100K people
- Death rate for hemorrhagic strokes, 2018-20: 8.5 per 100K people
- Death rate for ischemic strokes, 2018-20: 19.8 per 100K people
- Death rate for hemorrhagic strokes, 2018-20: 8.5 per 100K people
#3. Okanogan County

kathmanduphotog // Shutterstock
- Age-adjusted rate of all strokes among adults, estimates for 2021: 3.4% (range between 3.0% and 3.8%)
- Death rate for ischemic strokes, 2018-20: 21.3 per 100K people
- Death rate for hemorrhagic strokes, 2018-20: 6.3 per 100K people
- Death rate for ischemic strokes, 2018-20: 21.3 per 100K people
- Death rate for hemorrhagic strokes, 2018-20: 6.3 per 100K people
#2. Ferry County

Arpad Jasko // Shutterstock
- Age-adjusted rate of all strokes among adults, estimates for 2021: 3.5% (range between 3.1% and 4.0%)
- Death rate for ischemic strokes, 2018-20: 21.6 per 100K people
- Death rate for hemorrhagic strokes, 2018-20: 7.4 per 100K people
- Death rate for ischemic strokes, 2018-20: 21.6 per 100K people
- Death rate for hemorrhagic strokes, 2018-20: 7.4 per 100K people
This story features data reporting and writing by Emma Rubin and is part of a series utilizing data automation across 49 states.
#1. Adams County

Canva