Counties with the highest rates of strokes in West Virginia
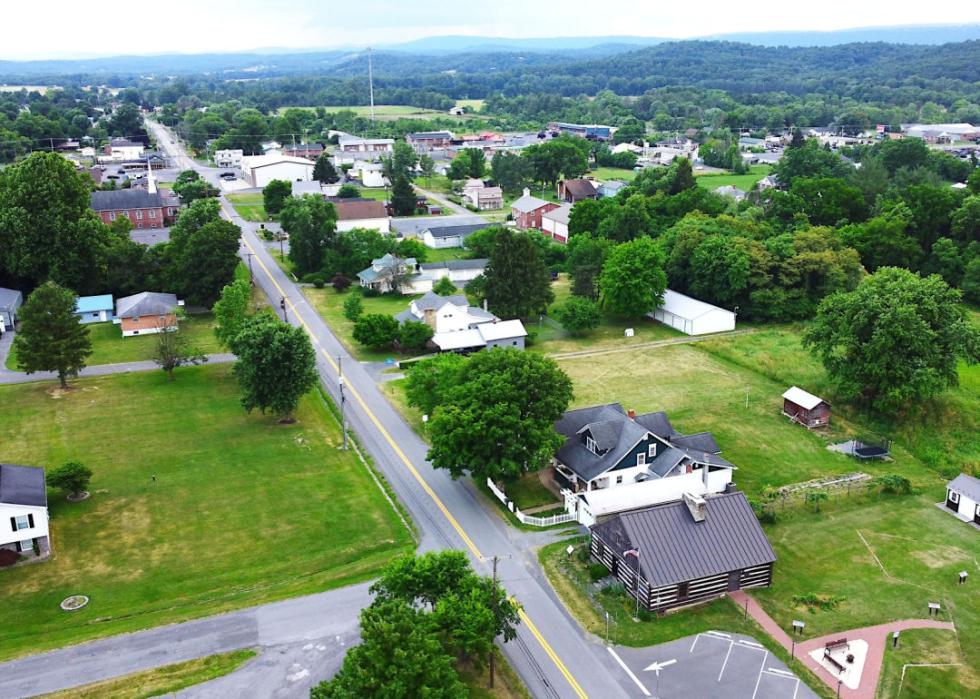
- Death rate for ischemic strokes, 2018-20: 22.0 per 100K people
- Death rate for hemorrhagic strokes, 2018-20: 8.0 per 100K people

- Death rate for ischemic strokes, 2018-20: 19.0 per 100K people
- Death rate for hemorrhagic strokes, 2018-20: 9.2 per 100K people

- Death rate for ischemic strokes, 2018-20: 19.1 per 100K people
- Death rate for hemorrhagic strokes, 2018-20: 7.4 per 100K people

- Death rate for ischemic strokes, 2018-20: 19.9 per 100K people
- Death rate for hemorrhagic strokes, 2018-20: 7.4 per 100K people
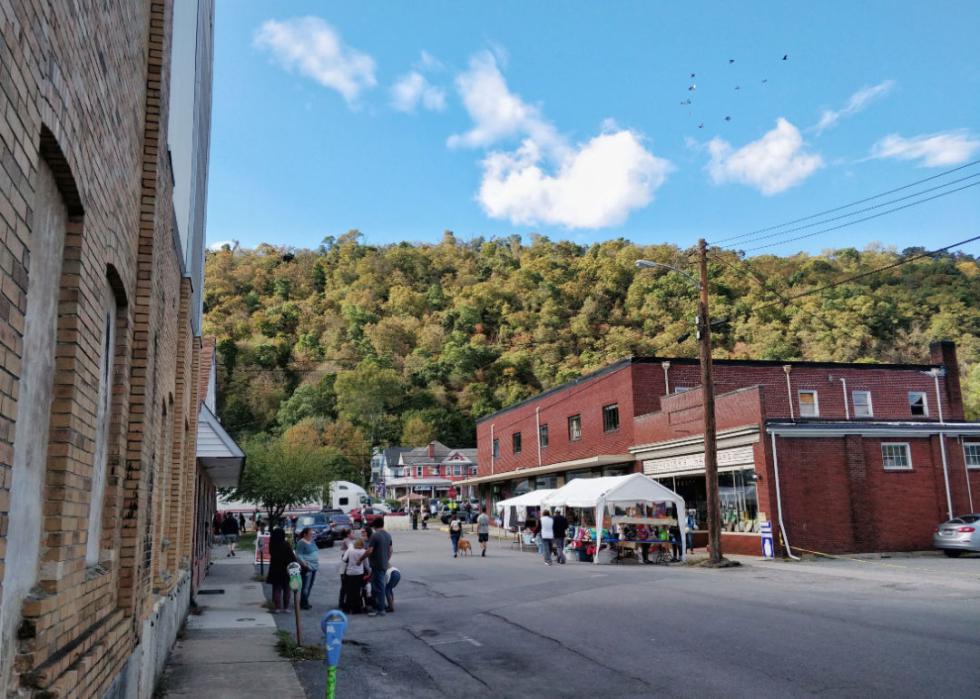
- Death rate for ischemic strokes, 2018-20: 22.4 per 100K people
- Death rate for hemorrhagic strokes, 2018-20: 9.0 per 100K people
You may also like: See how much of its wind energy potential West Virginia uses

- Death rate for ischemic strokes, 2018-20: 24.0 per 100K people
- Death rate for hemorrhagic strokes, 2018-20: 9.4 per 100K people

- Death rate for ischemic strokes, 2018-20: 16.1 per 100K people
- Death rate for hemorrhagic strokes, 2018-20: 6.8 per 100K people

- Death rate for ischemic strokes, 2018-20: 18.1 per 100K people
- Death rate for hemorrhagic strokes, 2018-20: 6.2 per 100K people

- Death rate for ischemic strokes, 2018-20: 20.5 per 100K people
- Death rate for hemorrhagic strokes, 2018-20: 9.7 per 100K people

- Death rate for ischemic strokes, 2018-20: 21.3 per 100K people
- Death rate for hemorrhagic strokes, 2018-20: 6.2 per 100K people
You may also like: Counties with highest COVID-19 infection rates in West Virginia
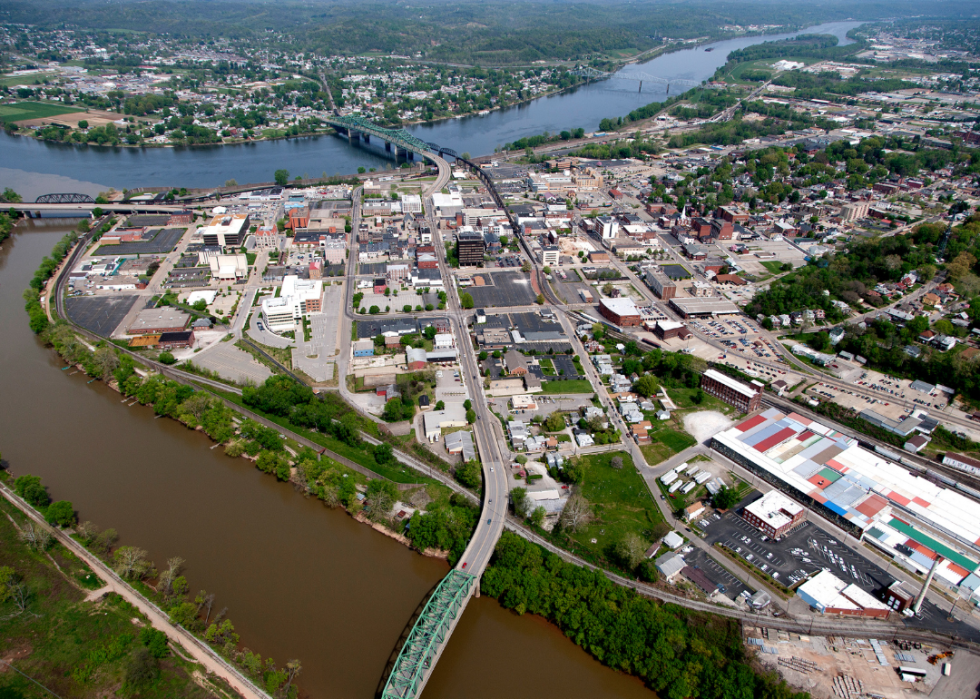
- Death rate for ischemic strokes, 2018-20: 21.8 per 100K people
- Death rate for hemorrhagic strokes, 2018-20: 9.7 per 100K people

- Death rate for ischemic strokes, 2018-20: 23.0 per 100K people
- Death rate for hemorrhagic strokes, 2018-20: 8.7 per 100K people

- Death rate for ischemic strokes, 2018-20: 29.6 per 100K people
- Death rate for hemorrhagic strokes, 2018-20: 9.5 per 100K people

- Death rate for ischemic strokes, 2018-20: 16.5 per 100K people
- Death rate for hemorrhagic strokes, 2018-20: 6.1 per 100K people

- Death rate for ischemic strokes, 2018-20: 21.2 per 100K people
- Death rate for hemorrhagic strokes, 2018-20: 5.9 per 100K people
You may also like: What West Virginia's immigrant population looked like in 1900

- Death rate for ischemic strokes, 2018-20: 23.1 per 100K people
- Death rate for hemorrhagic strokes, 2018-20: 7.8 per 100K people

- Death rate for ischemic strokes, 2018-20: 30.4 per 100K people
- Death rate for hemorrhagic strokes, 2018-20: 9.2 per 100K people

- Death rate for ischemic strokes, 2018-20: 16.2 per 100K people
- Death rate for hemorrhagic strokes, 2018-20: 7.8 per 100K people

- Death rate for ischemic strokes, 2018-20: 17.0 per 100K people
- Death rate for hemorrhagic strokes, 2018-20: 7.6 per 100K people

- Death rate for ischemic strokes, 2018-20: 19.1 per 100K people
- Death rate for hemorrhagic strokes, 2018-20: 8.2 per 100K people
You may also like: The Black homeownership gap in West Virginia

- Death rate for ischemic strokes, 2018-20: 19.5 per 100K people
- Death rate for hemorrhagic strokes, 2018-20: 6.1 per 100K people

- Death rate for ischemic strokes, 2018-20: 20.3 per 100K people
- Death rate for hemorrhagic strokes, 2018-20: 7.1 per 100K people

- Death rate for ischemic strokes, 2018-20: 21.8 per 100K people
- Death rate for hemorrhagic strokes, 2018-20: 5.6 per 100K people
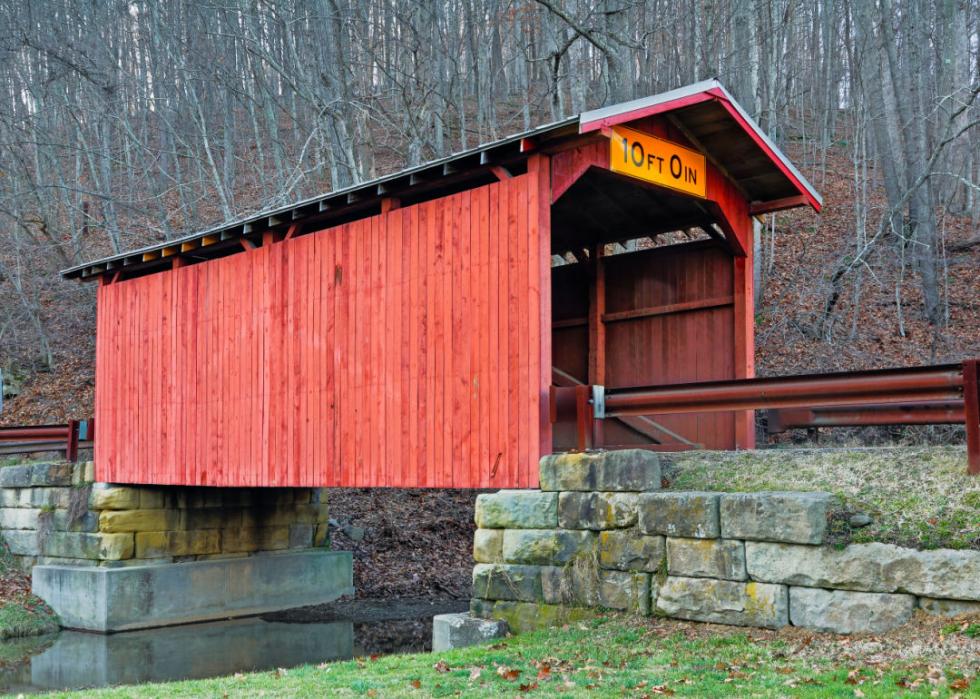
- Death rate for ischemic strokes, 2018-20: 22.3 per 100K people
- Death rate for hemorrhagic strokes, 2018-20: 7.1 per 100K people

- Death rate for ischemic strokes, 2018-20: 24.4 per 100K people
- Death rate for hemorrhagic strokes, 2018-20: 9.6 per 100K people
You may also like: Best school districts in West Virginia

- Death rate for ischemic strokes, 2018-20: 25.4 per 100K people
- Death rate for hemorrhagic strokes, 2018-20: 9.9 per 100K people
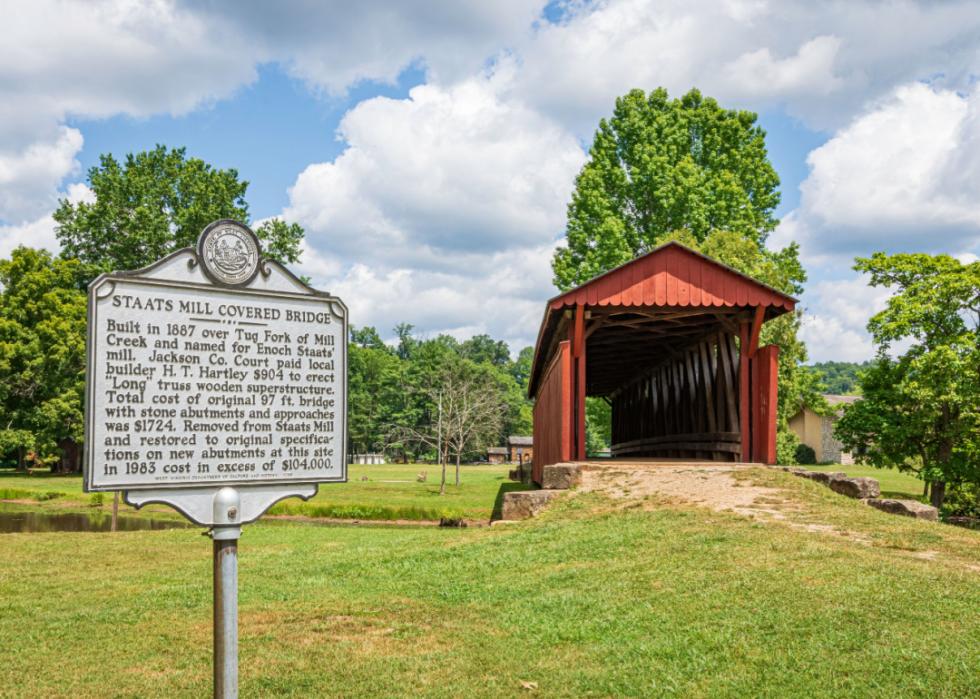
- Death rate for ischemic strokes, 2018-20: 26.8 per 100K people
- Death rate for hemorrhagic strokes, 2018-20: 10.1 per 100K people

- Death rate for ischemic strokes, 2018-20: 28.3 per 100K people
- Death rate for hemorrhagic strokes, 2018-20: 8.5 per 100K people

- Death rate for ischemic strokes, 2018-20: 18.9 per 100K people
- Death rate for hemorrhagic strokes, 2018-20: 6.7 per 100K people
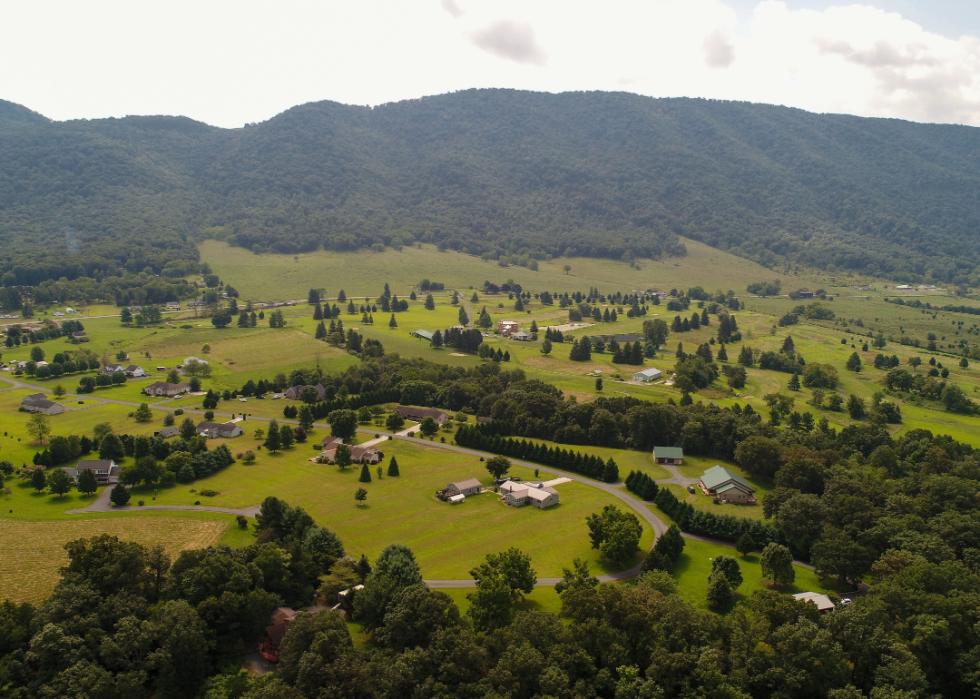
- Death rate for ischemic strokes, 2018-20: 19.3 per 100K people
- Death rate for hemorrhagic strokes, 2018-20: 7.7 per 100K people
You may also like: Counties with the highest rate of food insecurity in West Virginia

- Death rate for ischemic strokes, 2018-20: 21.5 per 100K people
- Death rate for hemorrhagic strokes, 2018-20: 8.6 per 100K people

- Death rate for ischemic strokes, 2018-20: 23.0 per 100K people
- Death rate for hemorrhagic strokes, 2018-20: 9.9 per 100K people

- Death rate for ischemic strokes, 2018-20: 29.1 per 100K people
- Death rate for hemorrhagic strokes, 2018-20: 9.8 per 100K people

- Death rate for ischemic strokes, 2018-20: 18.3 per 100K people
- Death rate for hemorrhagic strokes, 2018-20: 6.2 per 100K people

- Death rate for ischemic strokes, 2018-20: 21.9 per 100K people
- Death rate for hemorrhagic strokes, 2018-20: 9.6 per 100K people
You may also like: Highest-rated specialty museums in West Virginia, according to Tripadvisor

- Death rate for ischemic strokes, 2018-20: 24.6 per 100K people
- Death rate for hemorrhagic strokes, 2018-20: 8.3 per 100K people

- Death rate for ischemic strokes, 2018-20: 27.9 per 100K people
- Death rate for hemorrhagic strokes, 2018-20: 8.0 per 100K people

- Death rate for ischemic strokes, 2018-20: 29.0 per 100K people
- Death rate for hemorrhagic strokes, 2018-20: 9.1 per 100K people

- Death rate for ischemic strokes, 2018-20: 30.6 per 100K people
- Death rate for hemorrhagic strokes, 2018-20: 9.3 per 100K people
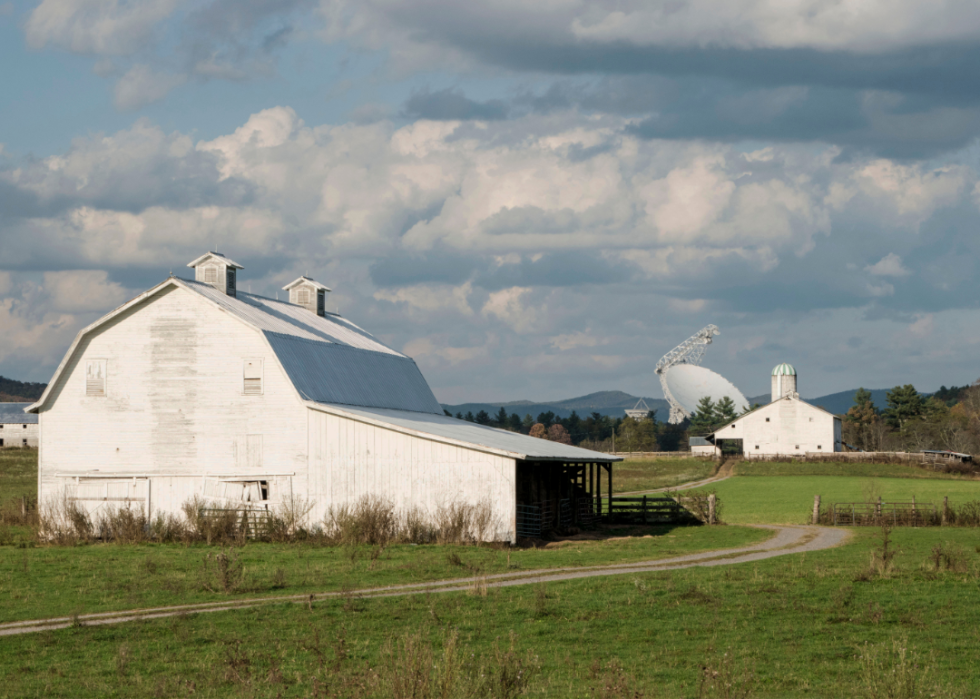
- Death rate for ischemic strokes, 2018-20: 23.7 per 100K people
- Death rate for hemorrhagic strokes, 2018-20: 7.4 per 100K people
You may also like: Highest-rated museums in West Virginia
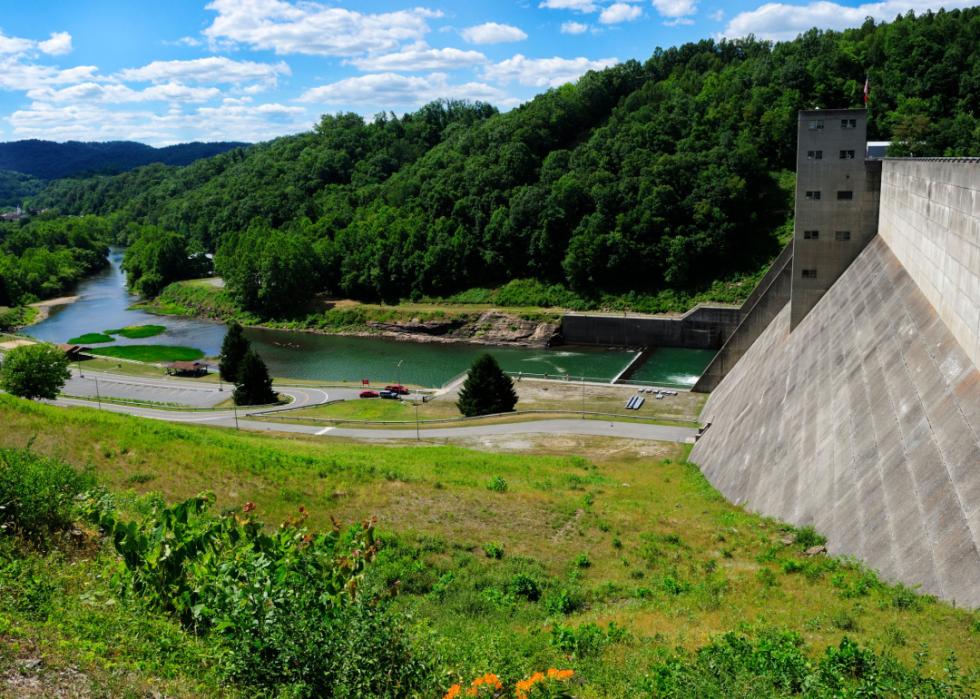
- Death rate for ischemic strokes, 2018-20: 27.3 per 100K people
- Death rate for hemorrhagic strokes, 2018-20: 4.9 per 100K people

- Death rate for ischemic strokes, 2018-20: 27.4 per 100K people
- Death rate for hemorrhagic strokes, 2018-20: 9.5 per 100K people

- Death rate for ischemic strokes, 2018-20: 28.3 per 100K people
- Death rate for hemorrhagic strokes, 2018-20: 8.4 per 100K people

- Death rate for ischemic strokes, 2018-20: 28.4 per 100K people
- Death rate for hemorrhagic strokes, 2018-20: 9.4 per 100K people

- Death rate for ischemic strokes, 2018-20: 29.8 per 100K people
- Death rate for hemorrhagic strokes, 2018-20: 9.5 per 100K people
You may also like: What to know about workers' compensation in West Virginia

- Death rate for ischemic strokes, 2018-20: 23.0 per 100K people
- Death rate for hemorrhagic strokes, 2018-20: 4.7 per 100K people

- Death rate for ischemic strokes, 2018-20: 26.8 per 100K people
- Death rate for hemorrhagic strokes, 2018-20: 7.3 per 100K people

- Death rate for ischemic strokes, 2018-20: 27.9 per 100K people
- Death rate for hemorrhagic strokes, 2018-20: 10.1 per 100K people
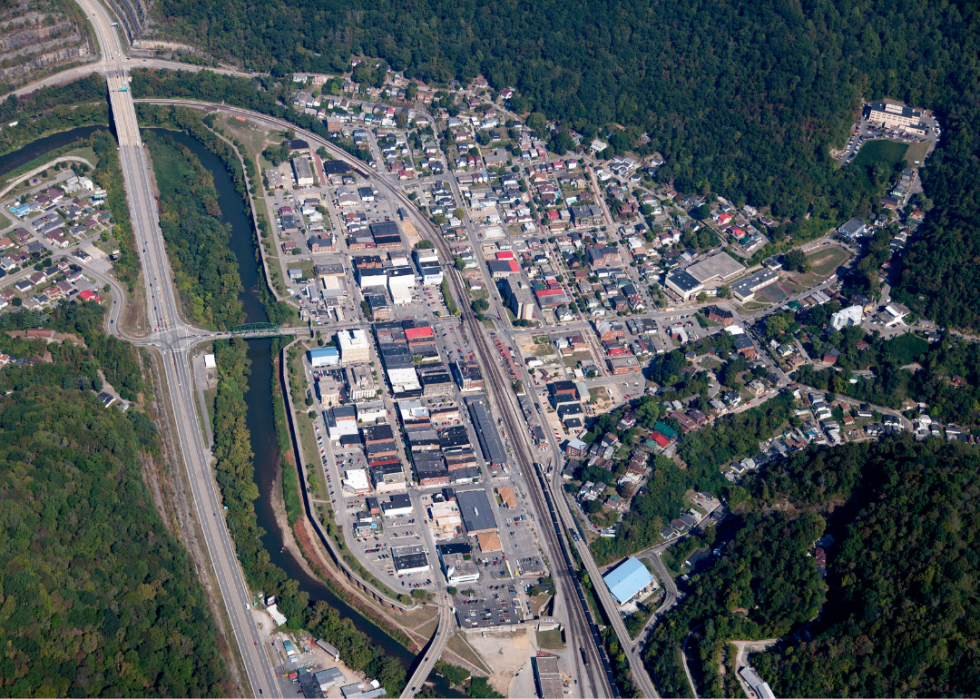
- Death rate for ischemic strokes, 2018-20: 26.9 per 100K people
- Death rate for hemorrhagic strokes, 2018-20: 9.6 per 100K people

- Death rate for ischemic strokes, 2018-20: 25.3 per 100K people
- Death rate for hemorrhagic strokes, 2018-20: 9.3 per 100K people
You may also like: Counties with the lowest hospital bed capacity in West Virginia
This story features data reporting and writing by Emma Rubin and is part of a series utilizing data automation across 49 states.
