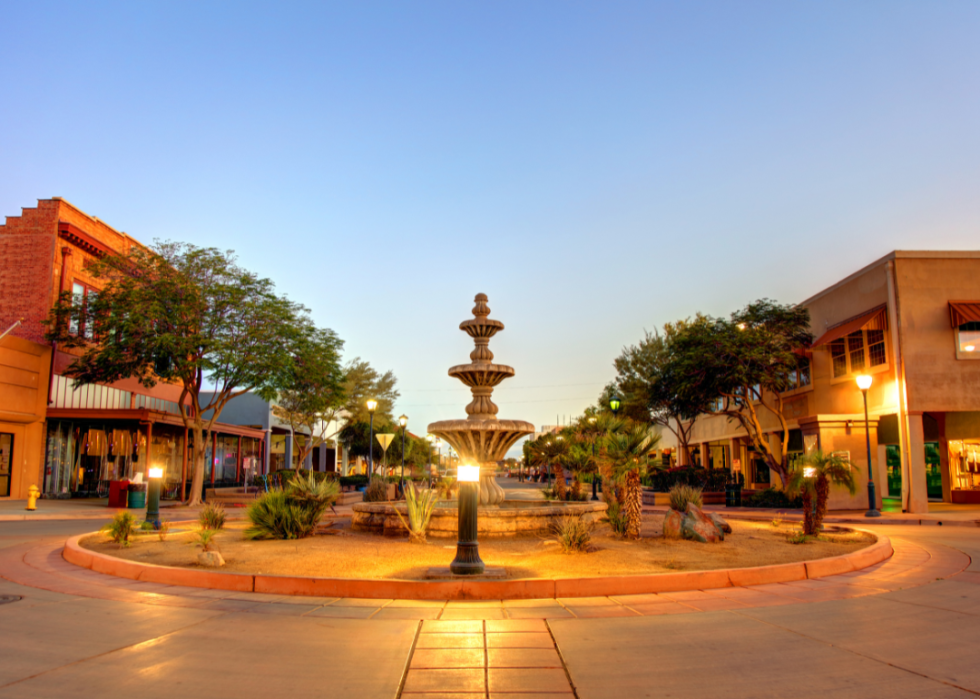
Counties with the highest rates of strokes in Arizona
Sean Pavone // Shutterstock
- Age-adjusted rate of all strokes among adults, estimates for 2021: 2.7% (range between 2.4% and 3.1%)
- Death rate for ischemic strokes, 2018-20: 15.0 per 100K people
- Death rate for hemorrhagic strokes, 2018-20: 5.9 per 100K people
- Death rate for ischemic strokes, 2018-20: 15.0 per 100K people
- Death rate for hemorrhagic strokes, 2018-20: 5.9 per 100K people
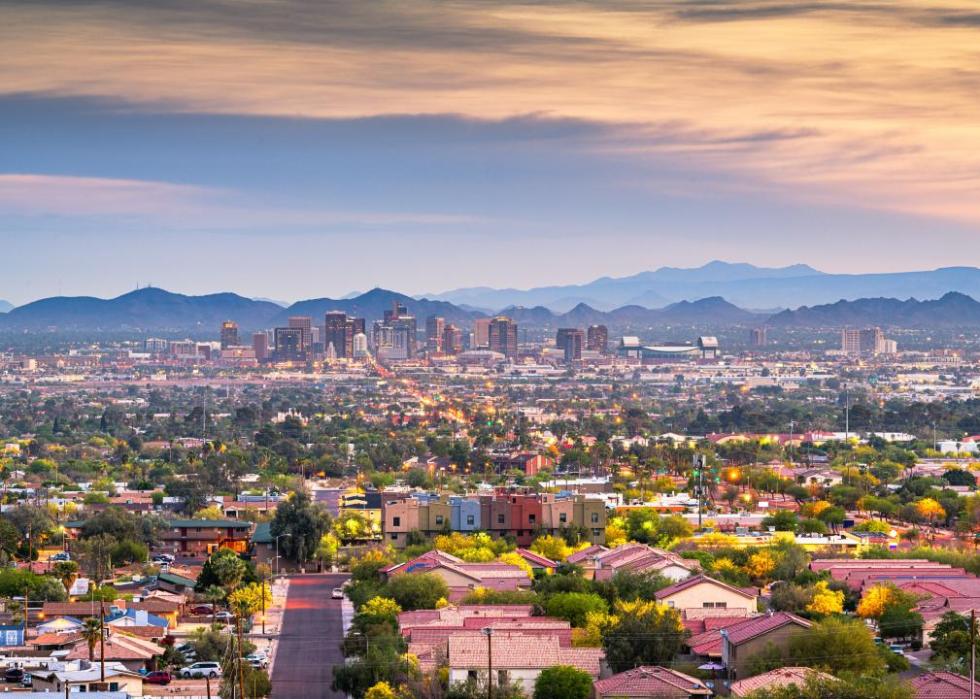
#15. Maricopa County
Canva
- Age-adjusted rate of all strokes among adults, estimates for 2021: 2.7% (range between 2.4% and 3.0%)
- Death rate for ischemic strokes, 2018-20: 17.6 per 100K people
- Death rate for hemorrhagic strokes, 2018-20: 7.3 per 100K people
- Death rate for ischemic strokes, 2018-20: 17.6 per 100K people
- Death rate for hemorrhagic strokes, 2018-20: 7.3 per 100K people
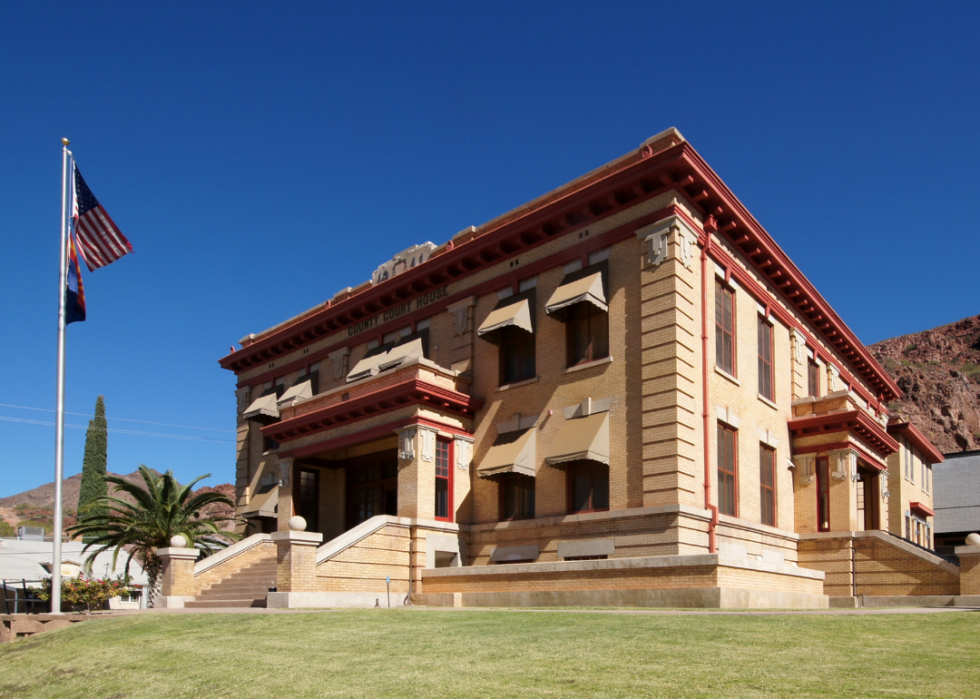
#14. Greenlee County
Jay Yuan // Shutterstock
- Age-adjusted rate of all strokes among adults, estimates for 2021: 2.8% (range between 2.5% and 3.2%)
- Death rate for ischemic strokes, 2018-20: 13.2 per 100K people
- Death rate for hemorrhagic strokes, 2018-20: 6.7 per 100K people
- Death rate for ischemic strokes, 2018-20: 13.2 per 100K people
- Death rate for hemorrhagic strokes, 2018-20: 6.7 per 100K people
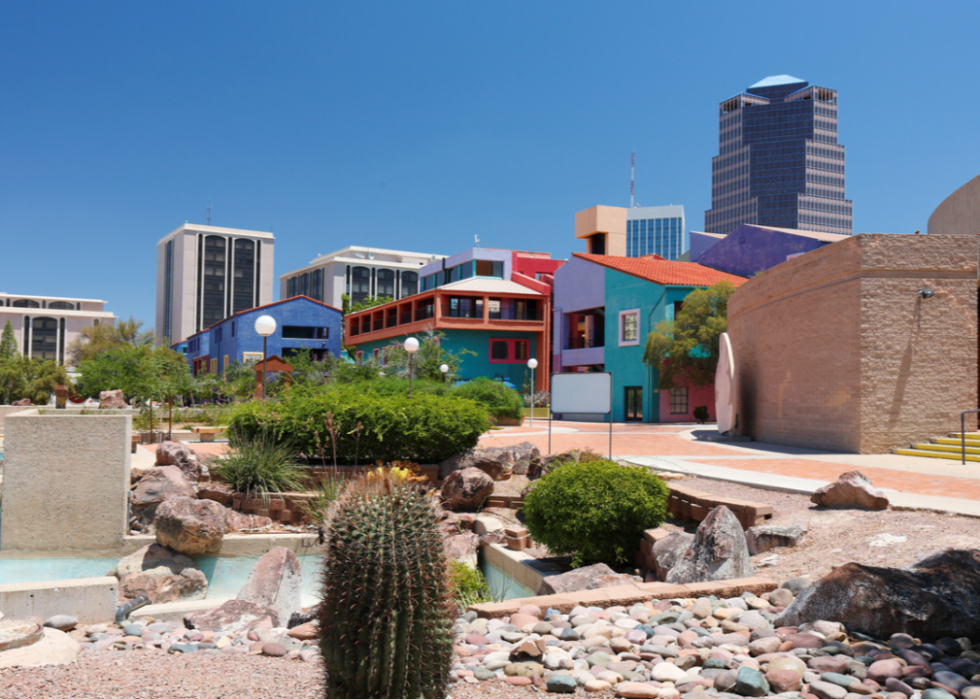
#13. Pima County

Canva
- Age-adjusted rate of all strokes among adults, estimates for 2021: 2.8% (range between 2.4% and 3.2%)
- Death rate for ischemic strokes, 2018-20: 15.0 per 100K people
- Death rate for hemorrhagic strokes, 2018-20: 5.9 per 100K people
- Death rate for ischemic strokes, 2018-20: 15.0 per 100K people
- Death rate for hemorrhagic strokes, 2018-20: 5.9 per 100K people
#12. Yavapai County
Canva
- Age-adjusted rate of all strokes among adults, estimates for 2021: 2.9% (range between 2.6% and 3.3%)
- Death rate for ischemic strokes, 2018-20: 12.4 per 100K people
- Death rate for hemorrhagic strokes, 2018-20: 6.0 per 100K people
- Death rate for ischemic strokes, 2018-20: 12.4 per 100K people
- Death rate for hemorrhagic strokes, 2018-20: 6.0 per 100K people
You may also like: Most valuable crops grown in Arizona
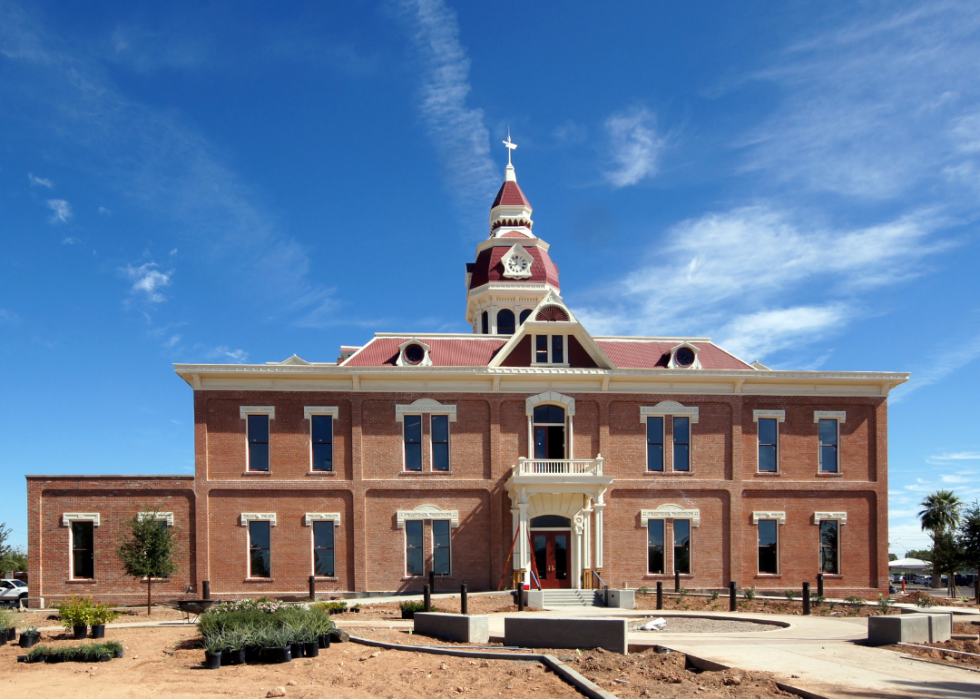
#11. Pinal County
Canva
- Age-adjusted rate of all strokes among adults, estimates for 2021: 2.9% (range between 2.6% and 3.3%)
- Death rate for ischemic strokes, 2018-20: 14.1 per 100K people
- Death rate for hemorrhagic strokes, 2018-20: 7.2 per 100K people
- Death rate for ischemic strokes, 2018-20: 14.1 per 100K people
- Death rate for hemorrhagic strokes, 2018-20: 7.2 per 100K people
#10. Cochise County
Canva
- Age-adjusted rate of all strokes among adults, estimates for 2021: 3.1% (range between 2.7% and 3.5%)
- Death rate for ischemic strokes, 2018-20: 16.9 per 100K people
- Death rate for hemorrhagic strokes, 2018-20: 8.5 per 100K people
- Death rate for ischemic strokes, 2018-20: 16.9 per 100K people
- Death rate for hemorrhagic strokes, 2018-20: 8.5 per 100K people
#9. Mohave County
Canva
- Age-adjusted rate of all strokes among adults, estimates for 2021: 3.2% (range between 2.8% and 3.7%)
- Death rate for ischemic strokes, 2018-20: 13.4 per 100K people
- Death rate for hemorrhagic strokes, 2018-20: 7.2 per 100K people
- Death rate for ischemic strokes, 2018-20: 13.4 per 100K people
- Death rate for hemorrhagic strokes, 2018-20: 7.2 per 100K people
#8. Santa Cruz County
HildaWeges Photography // Shutterstock
- Age-adjusted rate of all strokes among adults, estimates for 2021: 3.2% (range between 2.8% and 3.5%)
- Death rate for ischemic strokes, 2018-20: 16.1 per 100K people
- Death rate for hemorrhagic strokes, 2018-20: 6.3 per 100K people
- Death rate for ischemic strokes, 2018-20: 16.1 per 100K people
- Death rate for hemorrhagic strokes, 2018-20: 6.3 per 100K people
#7. Coconino County
Canva
- Age-adjusted rate of all strokes among adults, estimates for 2021: 3.3% (range between 2.9% and 3.7%)
- Death rate for ischemic strokes, 2018-20: 13.2 per 100K people
- Death rate for hemorrhagic strokes, 2018-20: 6.7 per 100K people
- Death rate for ischemic strokes, 2018-20: 13.2 per 100K people
- Death rate for hemorrhagic strokes, 2018-20: 6.7 per 100K people
You may also like: The Black homeownership gap in Arizona
#6. Yuma County
Canva
- Age-adjusted rate of all strokes among adults, estimates for 2021: 3.3% (range between 2.9% and 3.7%)
- Death rate for ischemic strokes, 2018-20: 14.8 per 100K people
- Death rate for hemorrhagic strokes, 2018-20: 5.9 per 100K people
- Death rate for ischemic strokes, 2018-20: 14.8 per 100K people
- Death rate for hemorrhagic strokes, 2018-20: 5.9 per 100K people
#5. Gila County
Canva
- Age-adjusted rate of all strokes among adults, estimates for 2021: 3.3% (range between 3.0% and 3.7%)
- Death rate for ischemic strokes, 2018-20: 15.6 per 100K people
- Death rate for hemorrhagic strokes, 2018-20: 7.1 per 100K people
- Death rate for ischemic strokes, 2018-20: 15.6 per 100K people
- Death rate for hemorrhagic strokes, 2018-20: 7.1 per 100K people
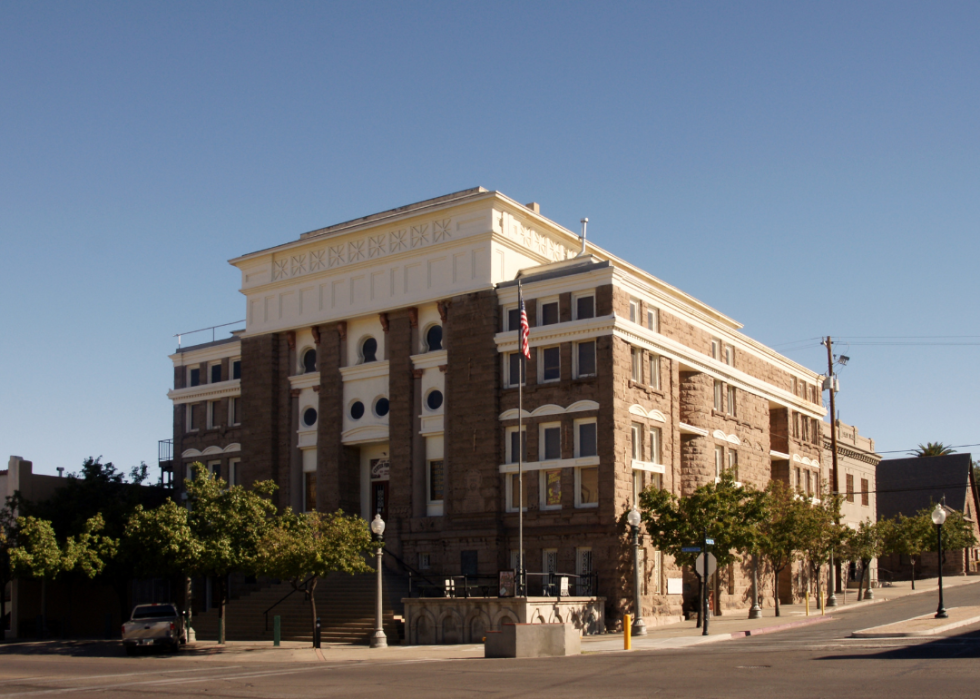
#4. Graham County
Canva
- Age-adjusted rate of all strokes among adults, estimates for 2021: 3.4% (range between 3.0% and 3.8%)
- Death rate for ischemic strokes, 2018-20: 14.9 per 100K people
- Death rate for hemorrhagic strokes, 2018-20: 7.6 per 100K people
- Death rate for ischemic strokes, 2018-20: 14.9 per 100K people
- Death rate for hemorrhagic strokes, 2018-20: 7.6 per 100K people
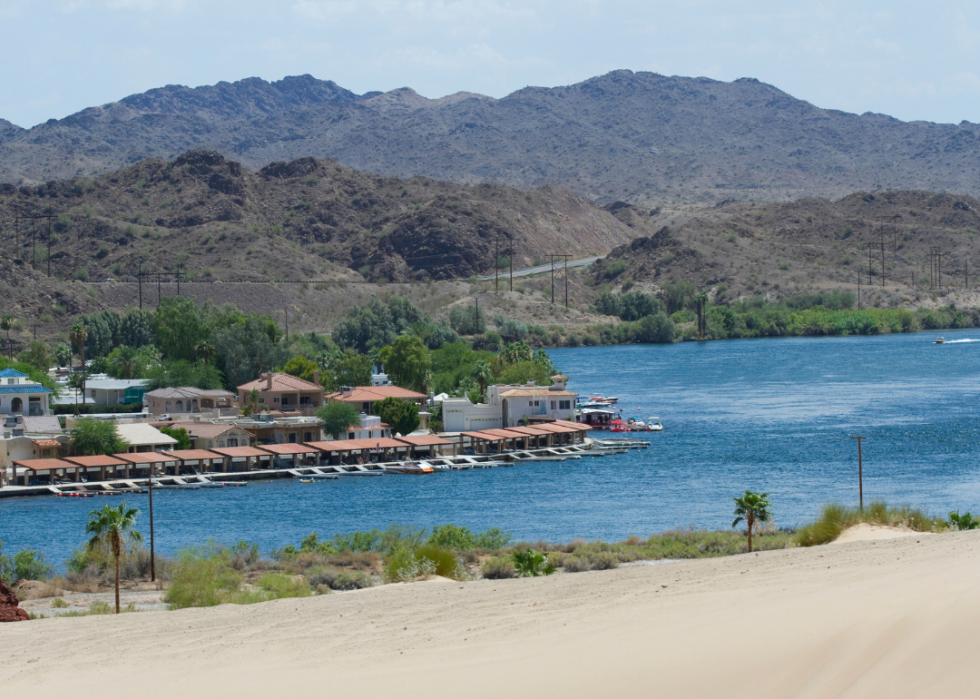
#3. La Paz County
Canva
- Age-adjusted rate of all strokes among adults, estimates for 2021: 4.1% (range between 3.7% and 4.5%)
- Death rate for ischemic strokes, 2018-20: 22.5 per 100K people
- Death rate for hemorrhagic strokes, 2018-20: 8.4 per 100K people
- Death rate for ischemic strokes, 2018-20: 22.5 per 100K people
- Death rate for hemorrhagic strokes, 2018-20: 8.4 per 100K people
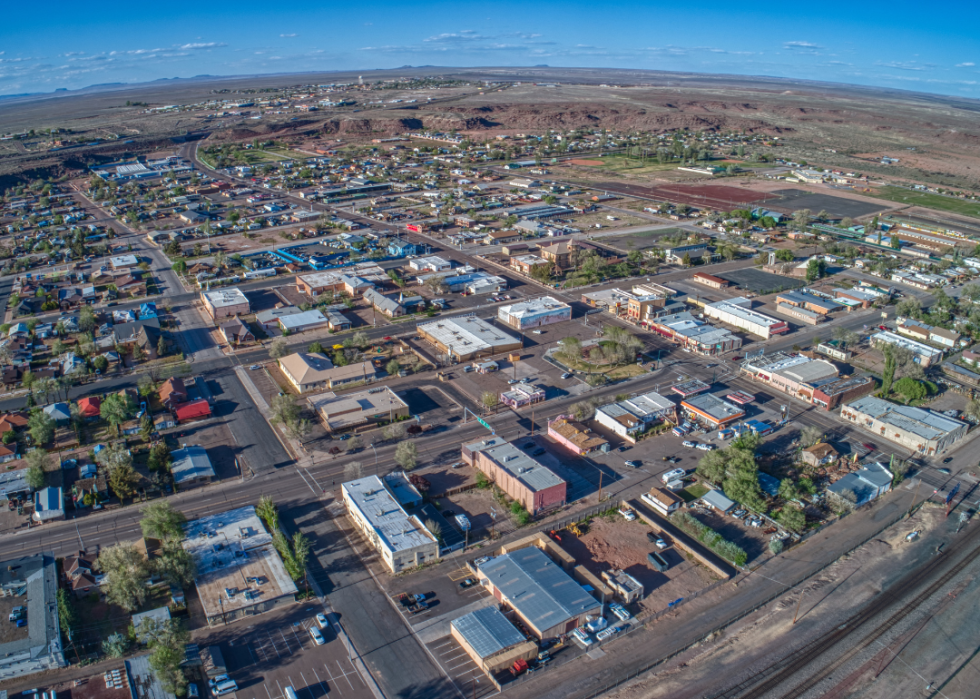
#2. Navajo County
Canva
- Age-adjusted rate of all strokes among adults, estimates for 2021: 5.3% (range between 4.7% and 5.9%)
- Death rate for ischemic strokes, 2018-20: 19.1 per 100K people
- Death rate for hemorrhagic strokes, 2018-20: 9.9 per 100K people
- Death rate for ischemic strokes, 2018-20: 19.1 per 100K people
- Death rate for hemorrhagic strokes, 2018-20: 9.9 per 100K people
You may also like: Counties with the most super commuters in Arizona
This story features data reporting and writing by Emma Rubin and is part of a series utilizing data automation across 49 states.
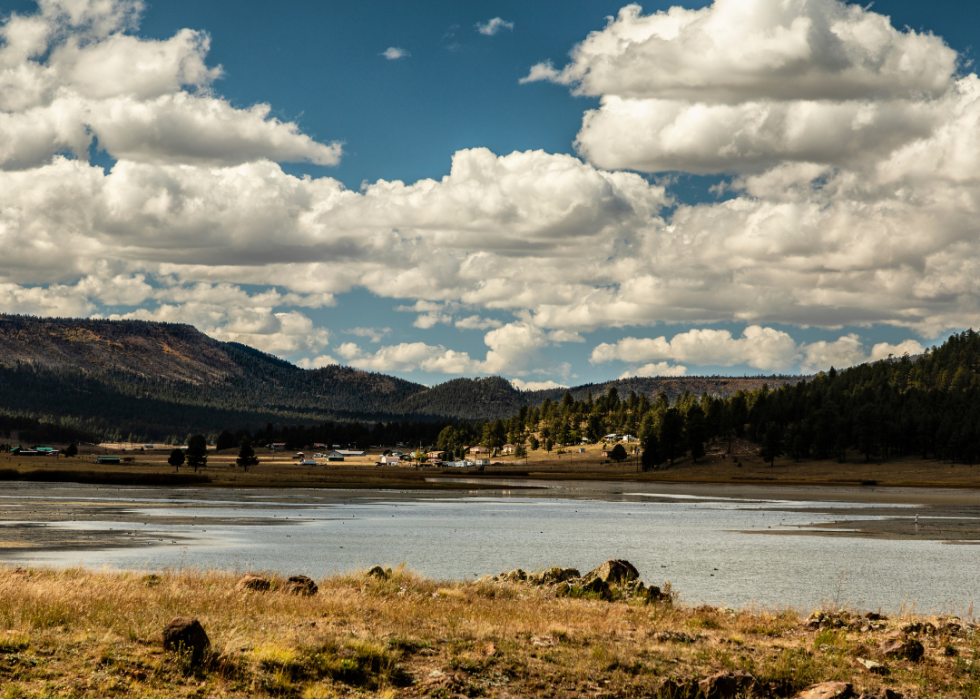
#1. Apache County

Canva