Counties with the highest rates of strokes in Kansas
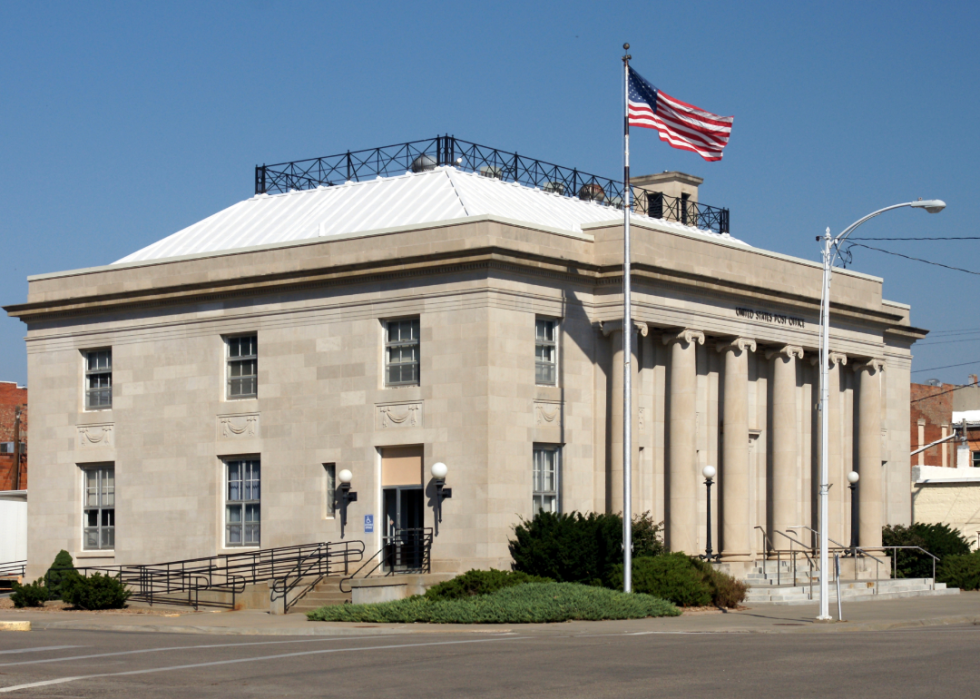
- Death rate for ischemic strokes, 2018-20: 18.3 per 100K people
- Death rate for hemorrhagic strokes, 2018-20: 5.0 per 100K people

- Death rate for ischemic strokes, 2018-20: 18.3 per 100K people
- Death rate for hemorrhagic strokes, 2018-20: 6.3 per 100K people
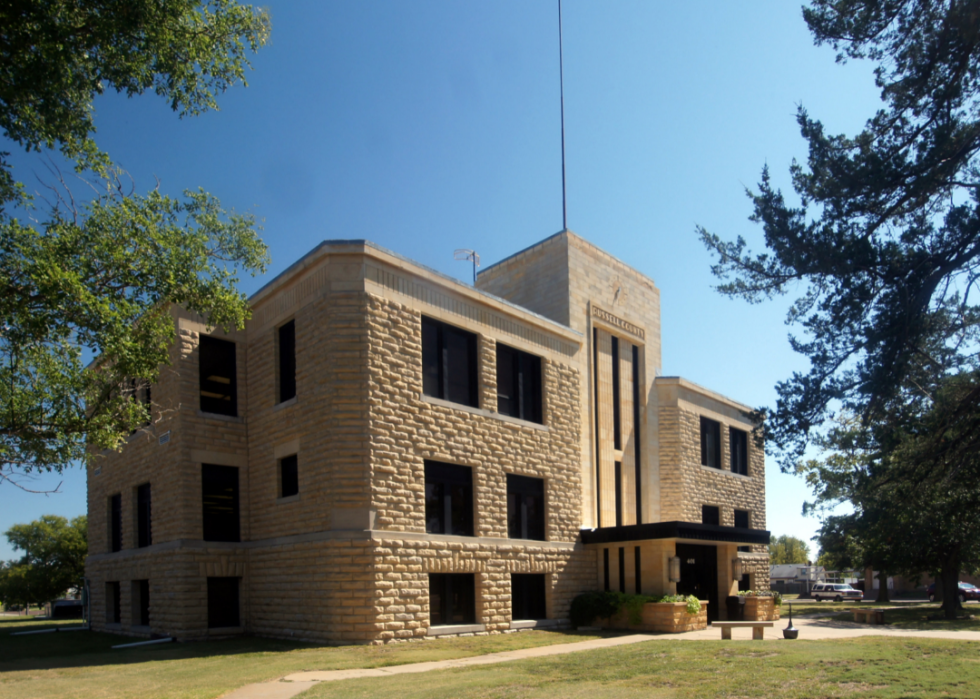
- Death rate for ischemic strokes, 2018-20: 18.4 per 100K people
- Death rate for hemorrhagic strokes, 2018-20: 9.1 per 100K people
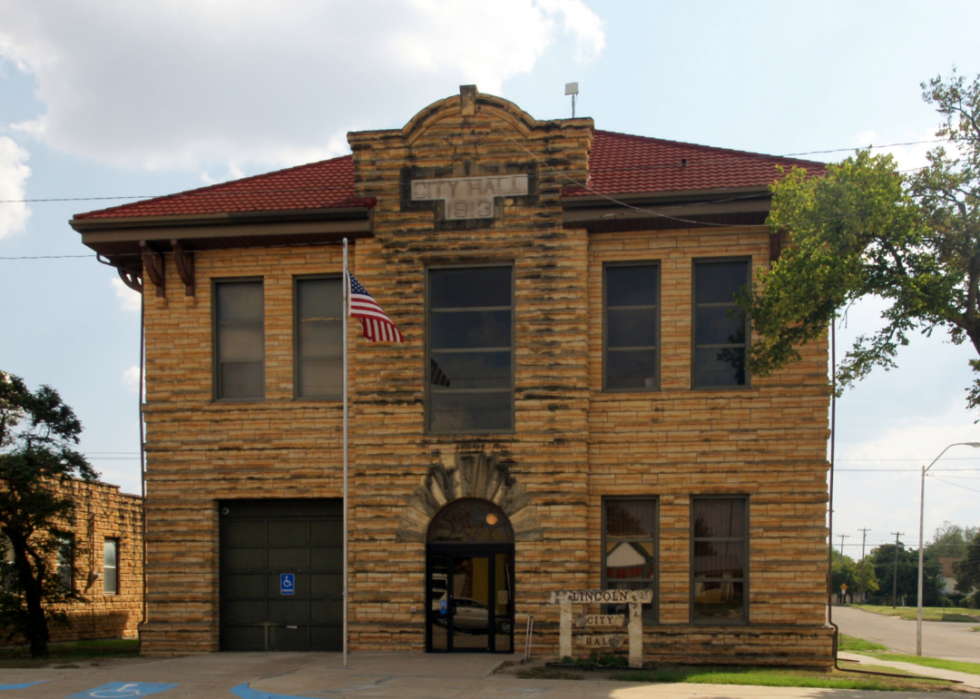
- Death rate for ischemic strokes, 2018-20: 18.5 per 100K people
- Death rate for hemorrhagic strokes, 2018-20: 13.9 per 100K people
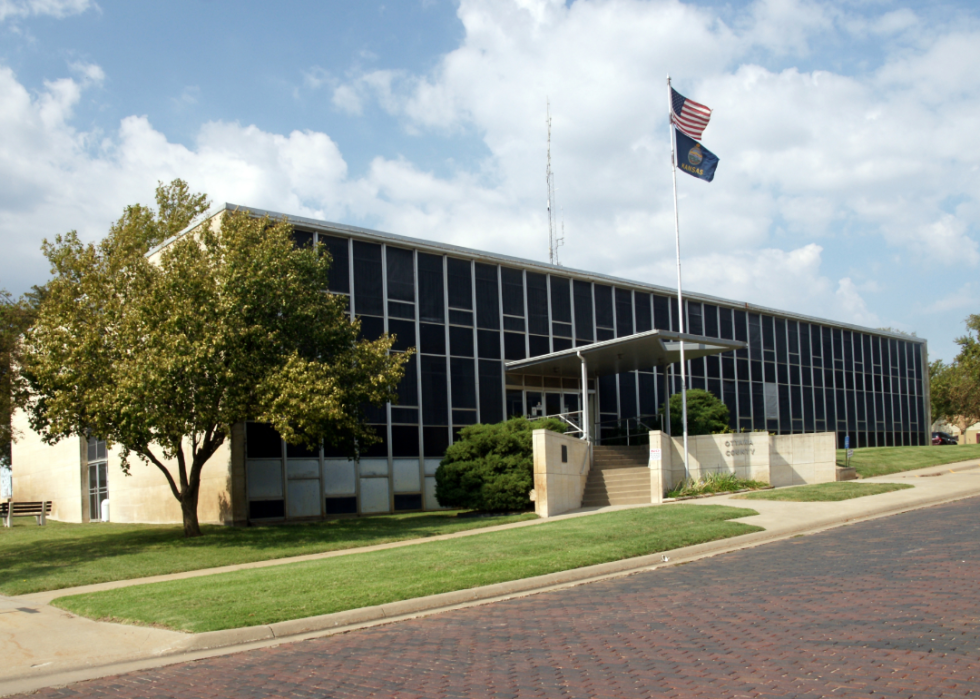
- Death rate for ischemic strokes, 2018-20: 19.0 per 100K people
- Death rate for hemorrhagic strokes, 2018-20: 12.3 per 100K people
You may also like: Counties with the most veterans in Kansas
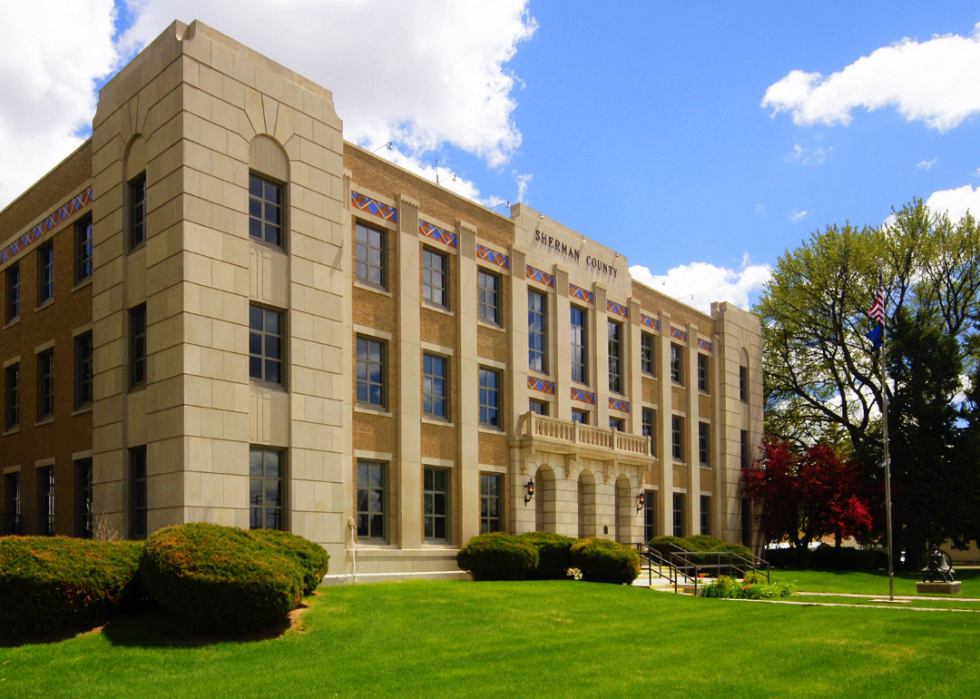
- Death rate for ischemic strokes, 2018-20: 20.3 per 100K people
- Death rate for hemorrhagic strokes, 2018-20: 8.1 per 100K people

- Death rate for ischemic strokes, 2018-20: 20.5 per 100K people
- Death rate for hemorrhagic strokes, 2018-20: 13.1 per 100K people

- Death rate for ischemic strokes, 2018-20: 21.2 per 100K people
- Death rate for hemorrhagic strokes, 2018-20: 9.6 per 100K people
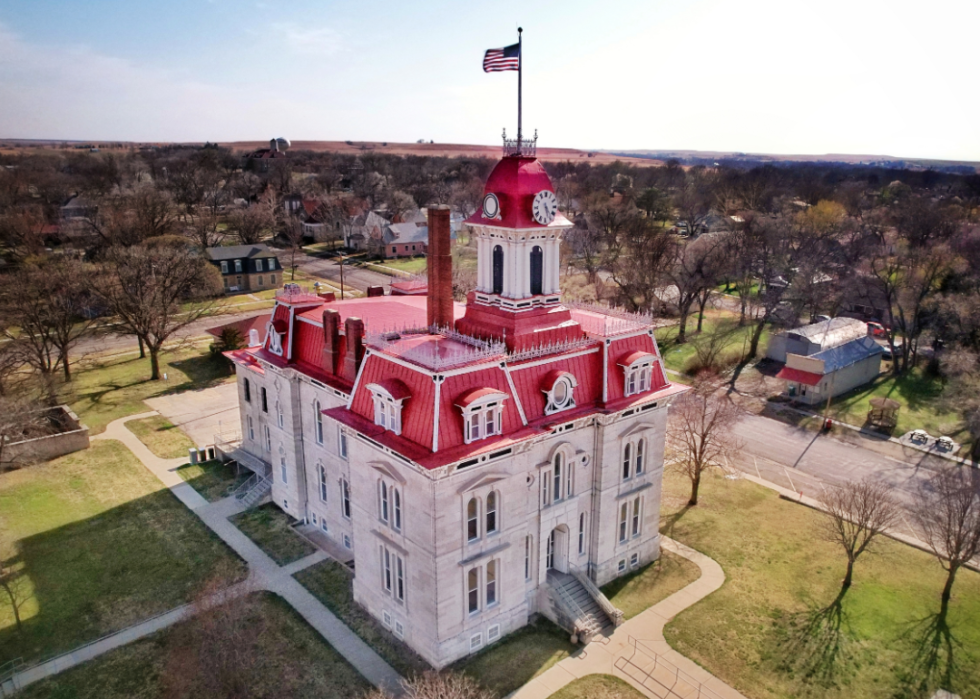
- Death rate for ischemic strokes, 2018-20: 21.3 per 100K people
- Death rate for hemorrhagic strokes, 2018-20: 10.7 per 100K people

- Death rate for ischemic strokes, 2018-20: 21.7 per 100K people
- Death rate for hemorrhagic strokes, 2018-20: 7.8 per 100K people
You may also like: Most popular baby names for girls of the last decade in Kansas
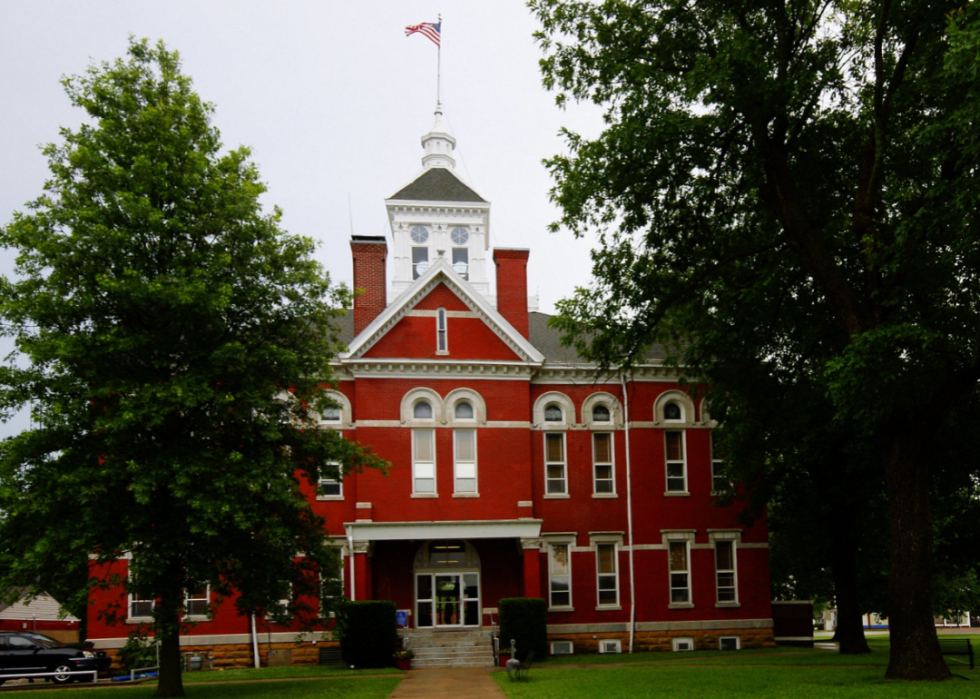
- Death rate for ischemic strokes, 2018-20: 22.5 per 100K people
- Death rate for hemorrhagic strokes, 2018-20: 10.4 per 100K people
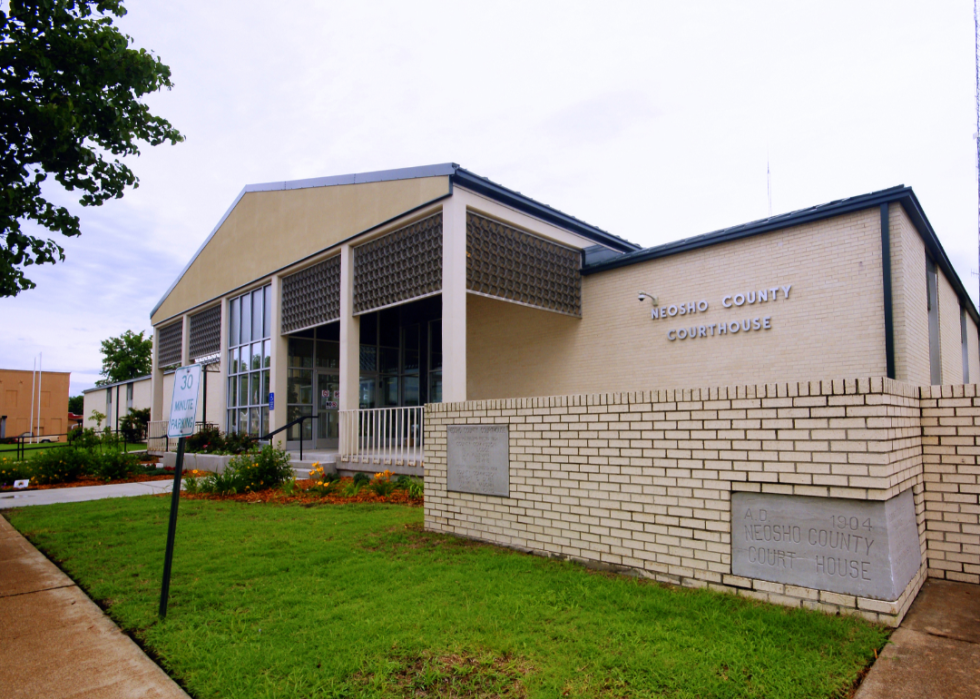
- Death rate for ischemic strokes, 2018-20: 23.4 per 100K people
- Death rate for hemorrhagic strokes, 2018-20: 10.0 per 100K people
- Death rate for ischemic strokes, 2018-20: 23.9 per 100K people
- Death rate for hemorrhagic strokes, 2018-20: 10.3 per 100K people

- Death rate for ischemic strokes, 2018-20: 24.3 per 100K people
- Death rate for hemorrhagic strokes, 2018-20: 9.3 per 100K people

- Death rate for ischemic strokes, 2018-20: 15.3 per 100K people
- Death rate for hemorrhagic strokes, 2018-20: 7.7 per 100K people
You may also like: Best counties to live in Kansas

- Death rate for ischemic strokes, 2018-20: 15.5 per 100K people
- Death rate for hemorrhagic strokes, 2018-20: 4.4 per 100K people
- Death rate for ischemic strokes, 2018-20: 16.4 per 100K people
- Death rate for hemorrhagic strokes, 2018-20: 5.3 per 100K people
- Death rate for ischemic strokes, 2018-20: 17.5 per 100K people
- Death rate for hemorrhagic strokes, 2018-20: 11.8 per 100K people
- Death rate for ischemic strokes, 2018-20: 17.8 per 100K people
- Death rate for hemorrhagic strokes, 2018-20: 11.7 per 100K people
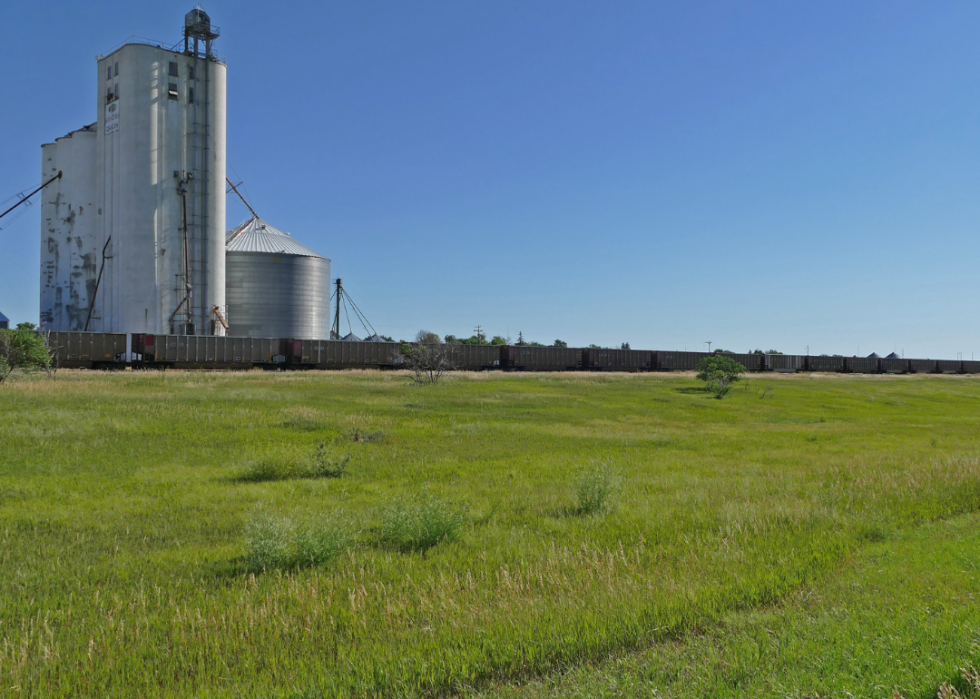
- Death rate for ischemic strokes, 2018-20: 20.1 per 100K people
- Death rate for hemorrhagic strokes, 2018-20: 6.3 per 100K people
You may also like: Plessy v. Ferguson meets its end: A major civil rights moment in Kansas

- Death rate for ischemic strokes, 2018-20: 20.5 per 100K people
- Death rate for hemorrhagic strokes, 2018-20: 11.8 per 100K people

- Death rate for ischemic strokes, 2018-20: 21.1 per 100K people
- Death rate for hemorrhagic strokes, 2018-20: 9.0 per 100K people

- Death rate for ischemic strokes, 2018-20: 22.8 per 100K people
- Death rate for hemorrhagic strokes, 2018-20: 10.8 per 100K people

- Death rate for ischemic strokes, 2018-20: 23.3 per 100K people
- Death rate for hemorrhagic strokes, 2018-20: 9.2 per 100K people

- Death rate for ischemic strokes, 2018-20: 23.8 per 100K people
- Death rate for hemorrhagic strokes, 2018-20: 10.3 per 100K people
You may also like: Best public high schools in Kansas
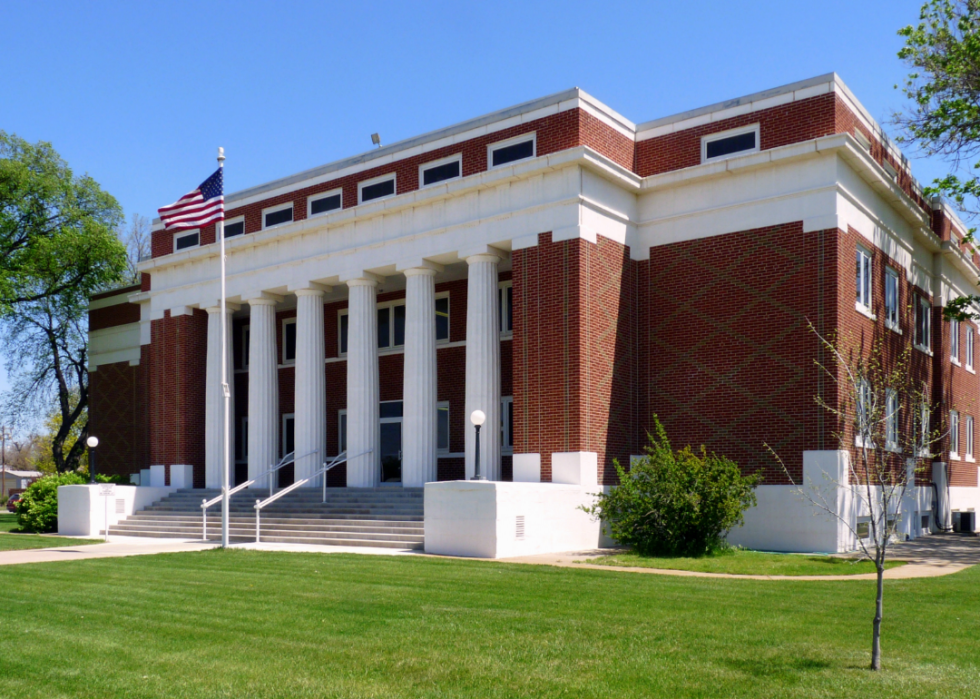
- Death rate for ischemic strokes, 2018-20: 23.9 per 100K people
- Death rate for hemorrhagic strokes, 2018-20: 13.4 per 100K people

- Death rate for ischemic strokes, 2018-20: 34.9 per 100K people
- Death rate for hemorrhagic strokes, 2018-20: 10.4 per 100K people

- Death rate for ischemic strokes, 2018-20: 12.3 per 100K people
- Death rate for hemorrhagic strokes, 2018-20: 10.5 per 100K people

- Death rate for ischemic strokes, 2018-20: 16.6 per 100K people
- Death rate for hemorrhagic strokes, 2018-20: 10.2 per 100K people
- Death rate for ischemic strokes, 2018-20: 18.7 per 100K people
- Death rate for hemorrhagic strokes, 2018-20: 10.7 per 100K people
You may also like: Highest-earning counties in Kansas
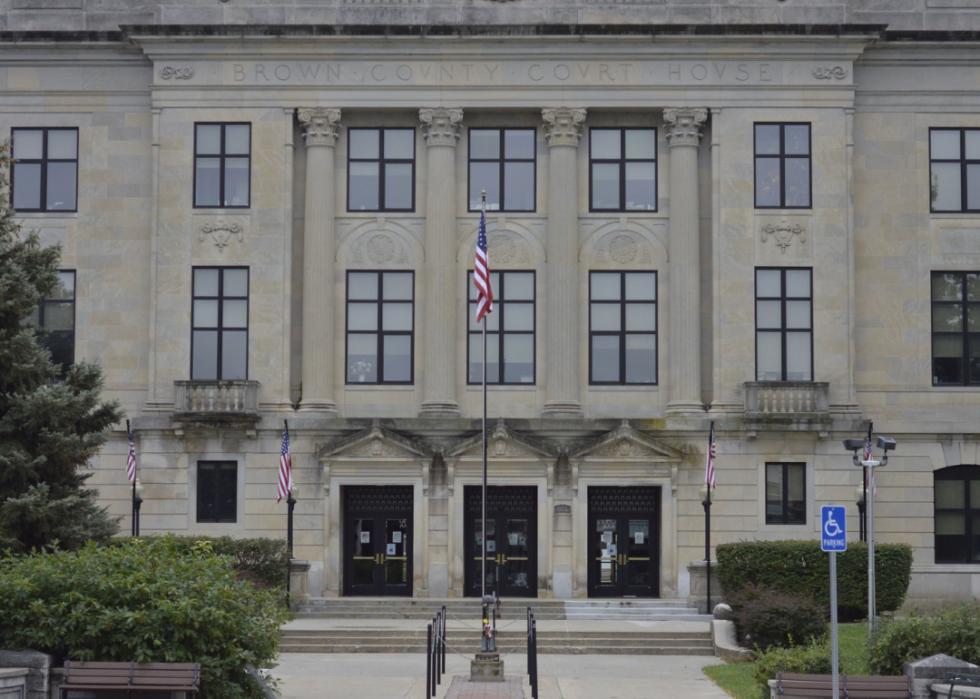
- Death rate for ischemic strokes, 2018-20: 20.4 per 100K people
- Death rate for hemorrhagic strokes, 2018-20: 14.1 per 100K people
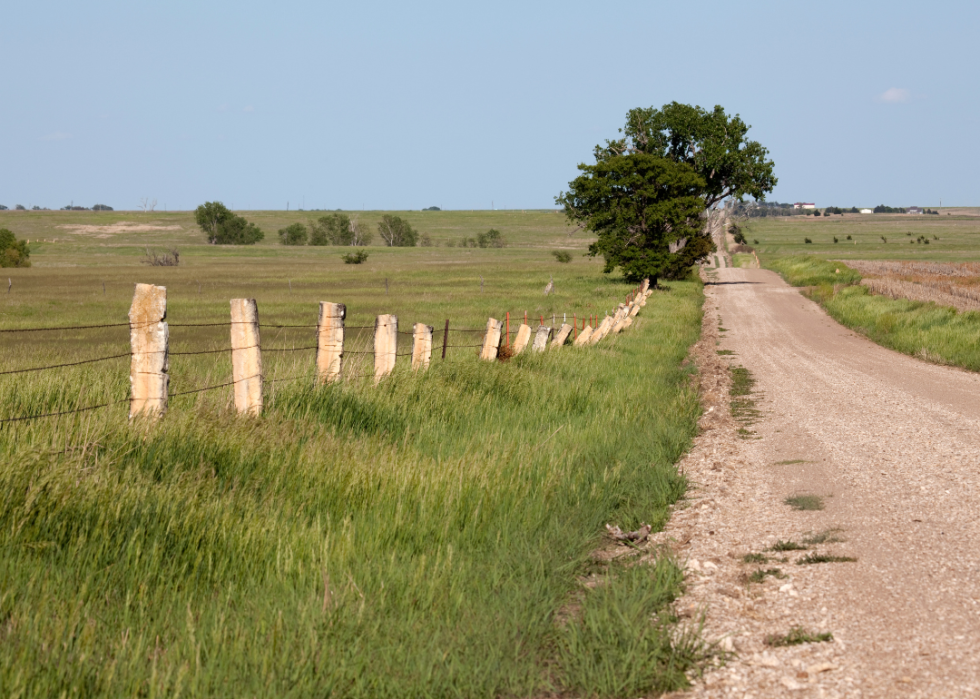
- Death rate for ischemic strokes, 2018-20: 21.1 per 100K people
- Death rate for hemorrhagic strokes, 2018-20: 5.4 per 100K people
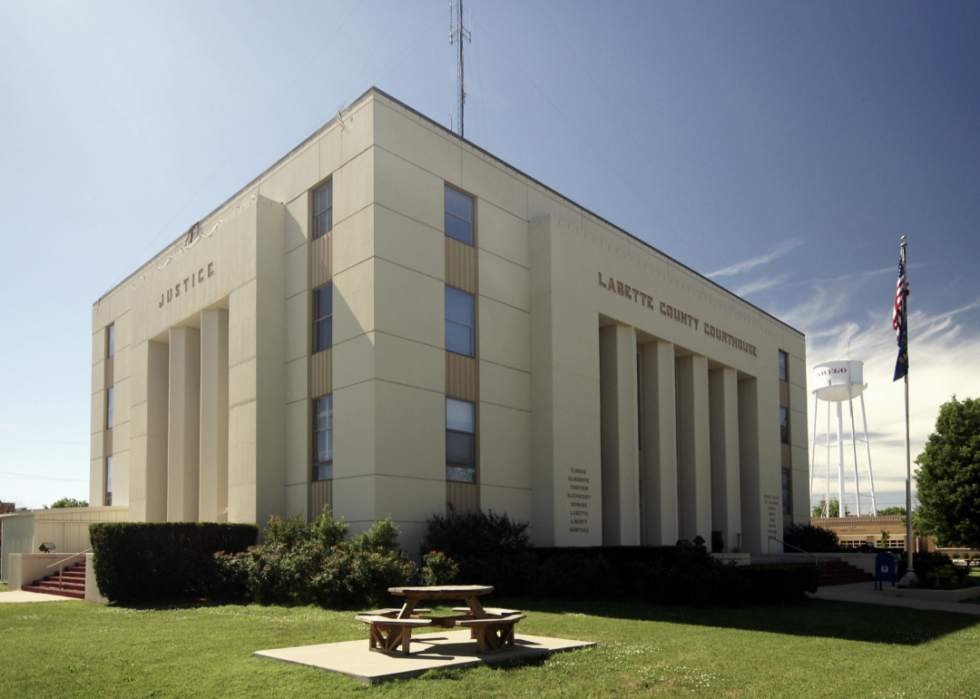
- Death rate for ischemic strokes, 2018-20: 23.1 per 100K people
- Death rate for hemorrhagic strokes, 2018-20: 9.3 per 100K people
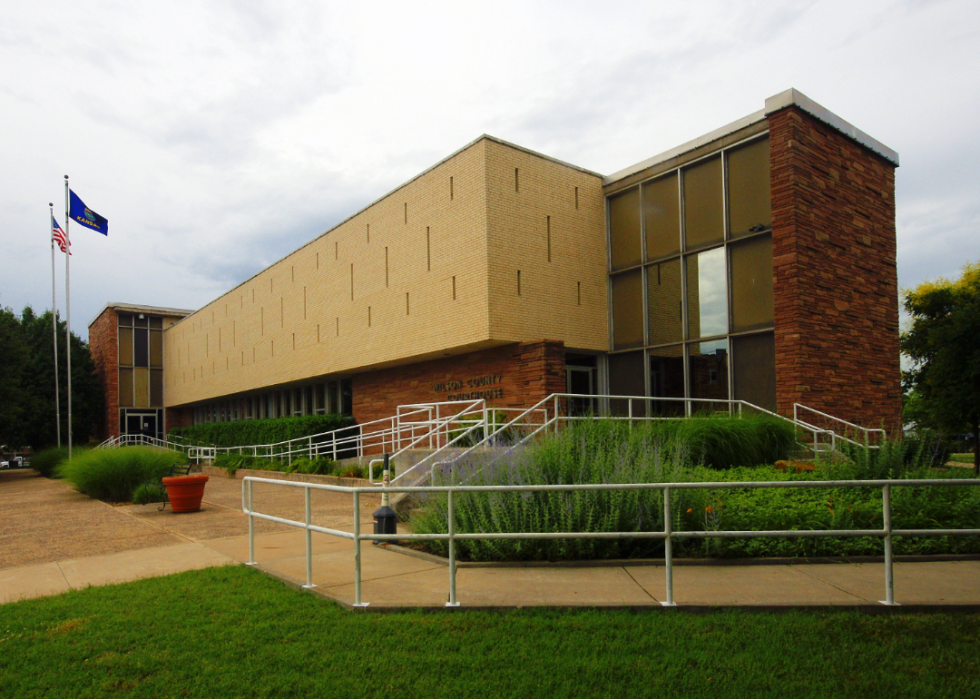
- Death rate for ischemic strokes, 2018-20: 23.1 per 100K people
- Death rate for hemorrhagic strokes, 2018-20: 11.1 per 100K people
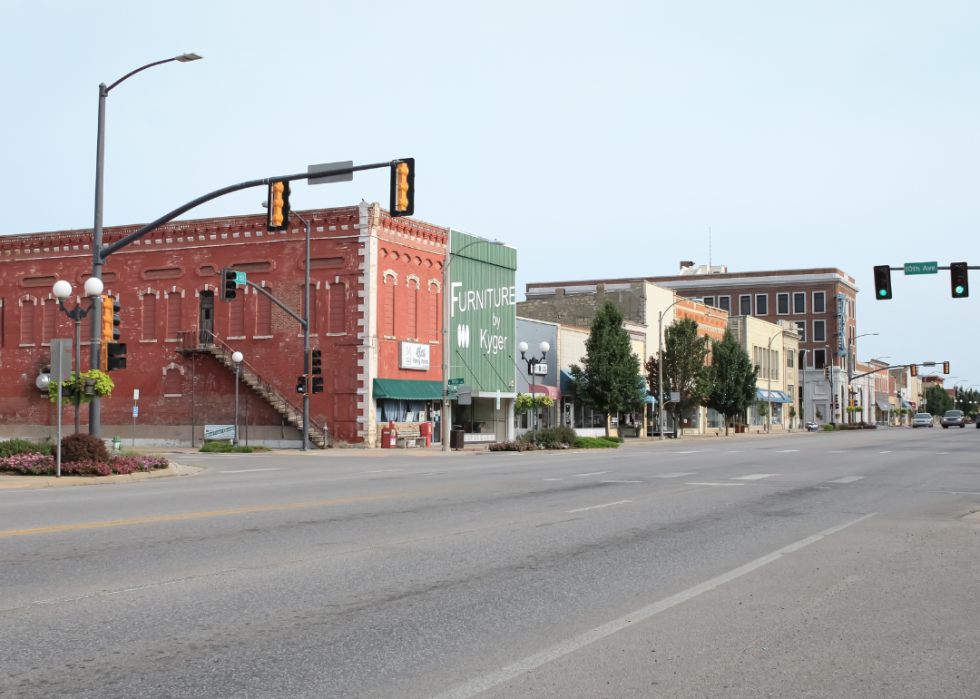
- Death rate for ischemic strokes, 2018-20: 24.0 per 100K people
- Death rate for hemorrhagic strokes, 2018-20: 7.7 per 100K people
You may also like: Lowest-earning counties in Kansas
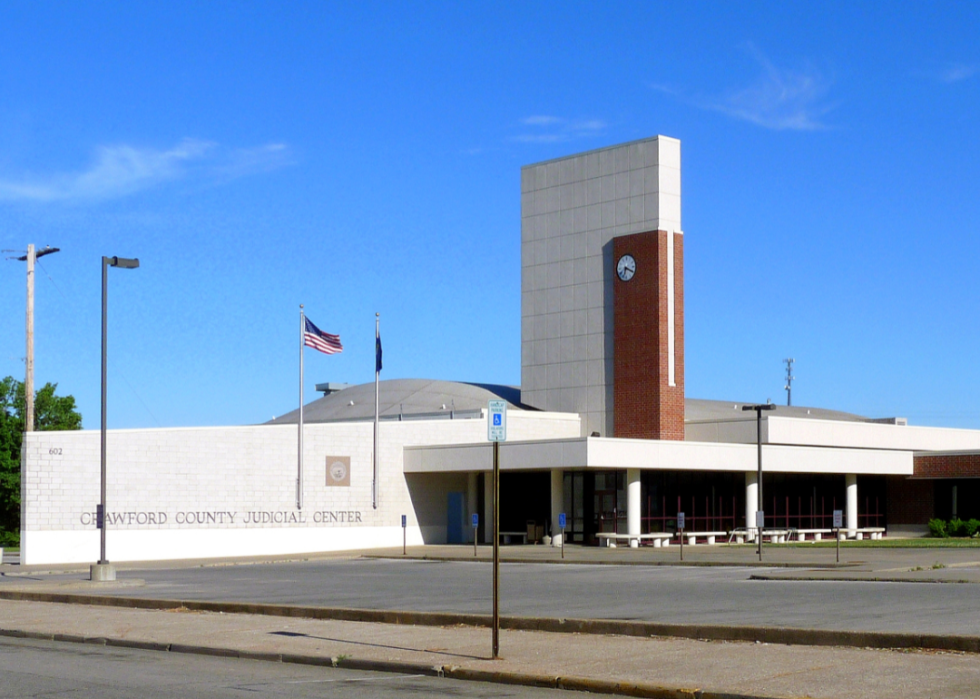
- Death rate for ischemic strokes, 2018-20: 24.0 per 100K people
- Death rate for hemorrhagic strokes, 2018-20: 10.2 per 100K people

- Death rate for ischemic strokes, 2018-20: 16.0 per 100K people
- Death rate for hemorrhagic strokes, 2018-20: 10.4 per 100K people
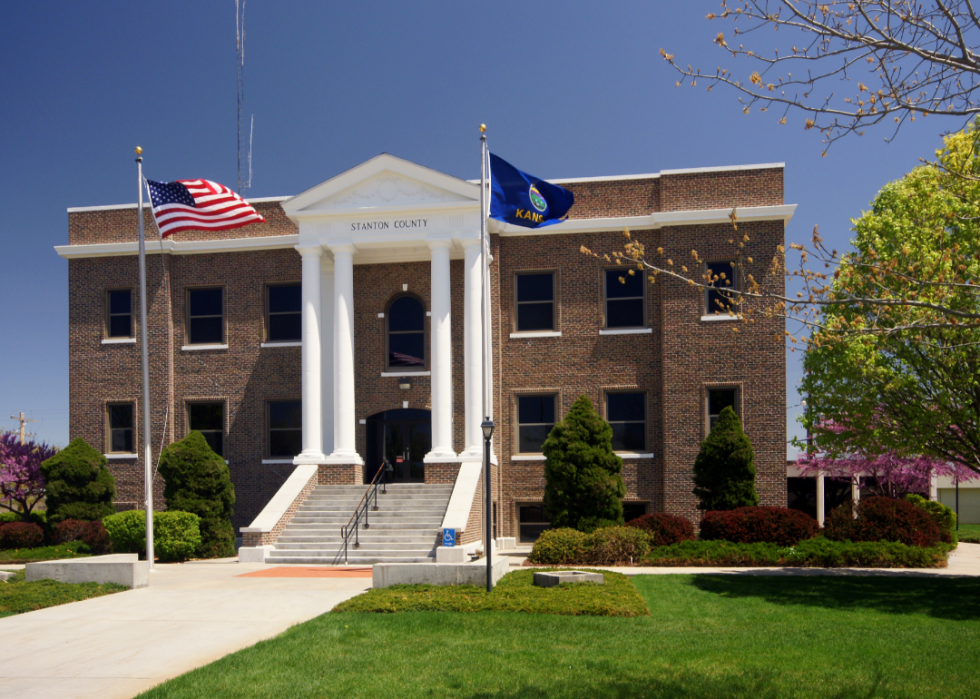
- Death rate for ischemic strokes, 2018-20: 16.8 per 100K people
- Death rate for hemorrhagic strokes, 2018-20: 6.3 per 100K people

- Death rate for ischemic strokes, 2018-20: 19.5 per 100K people
- Death rate for hemorrhagic strokes, 2018-20: 11.4 per 100K people
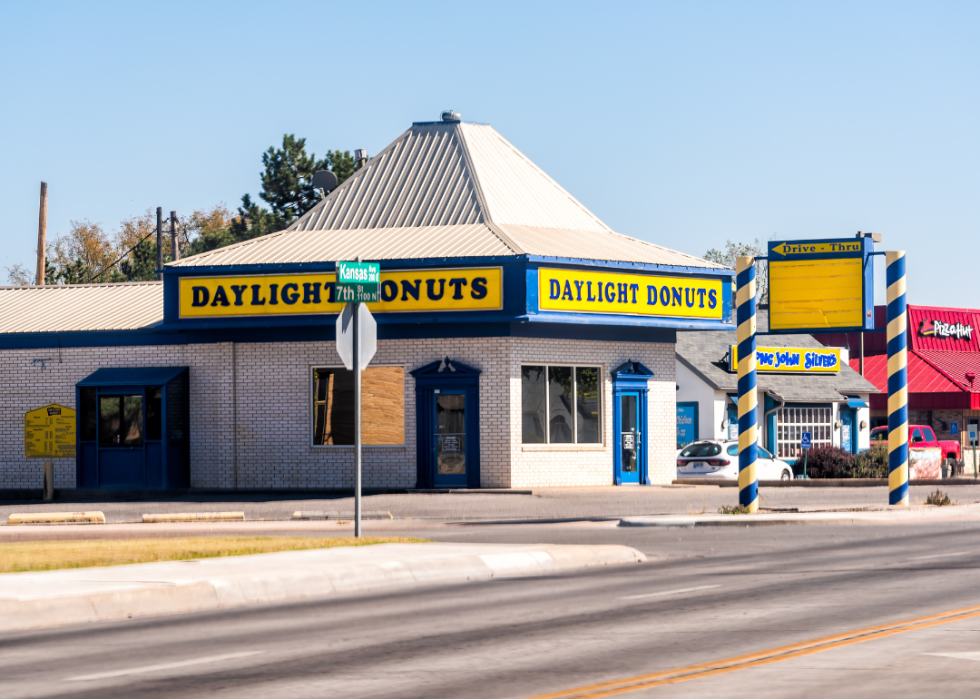
- Death rate for ischemic strokes, 2018-20: 19.6 per 100K people
- Death rate for hemorrhagic strokes, 2018-20: 9.5 per 100K people
You may also like: Counties with the lowest home prices in Kansas

- Death rate for ischemic strokes, 2018-20: 20.0 per 100K people
- Death rate for hemorrhagic strokes, 2018-20: 9.1 per 100K people
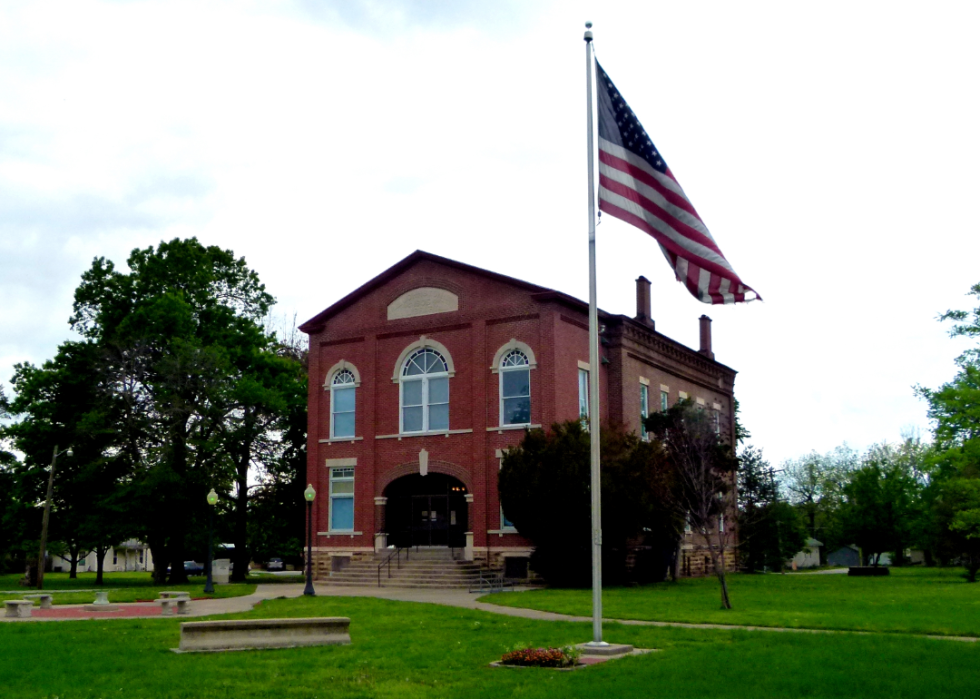
- Death rate for ischemic strokes, 2018-20: 23.8 per 100K people
- Death rate for hemorrhagic strokes, 2018-20: 10.0 per 100K people

- Death rate for ischemic strokes, 2018-20: 24.0 per 100K people
- Death rate for hemorrhagic strokes, 2018-20: 10.4 per 100K people
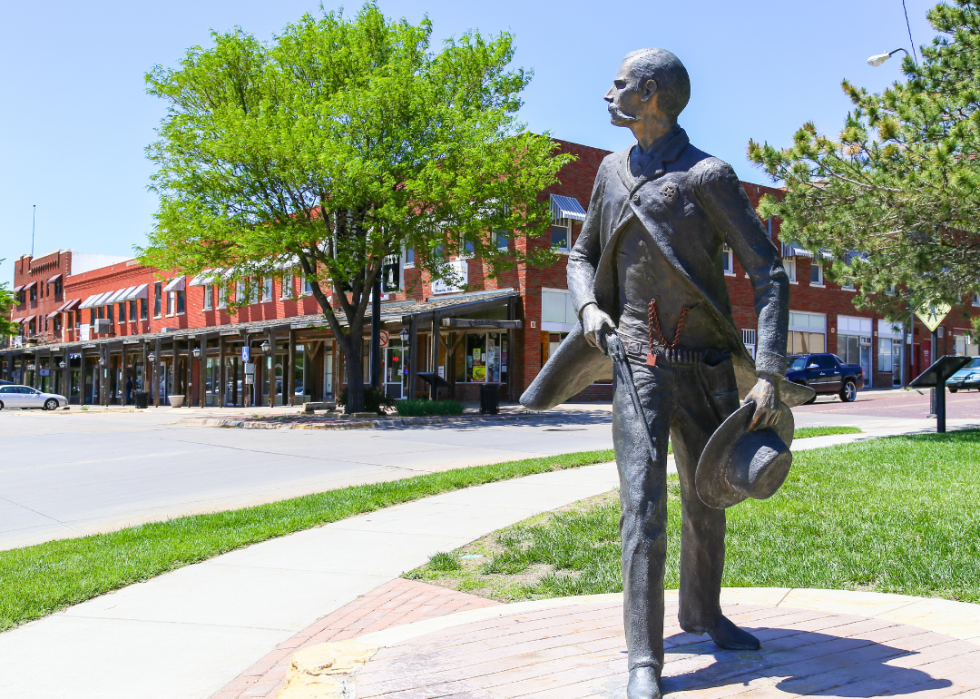
- Death rate for ischemic strokes, 2018-20: 24.0 per 100K people
- Death rate for hemorrhagic strokes, 2018-20: 14.0 per 100K people
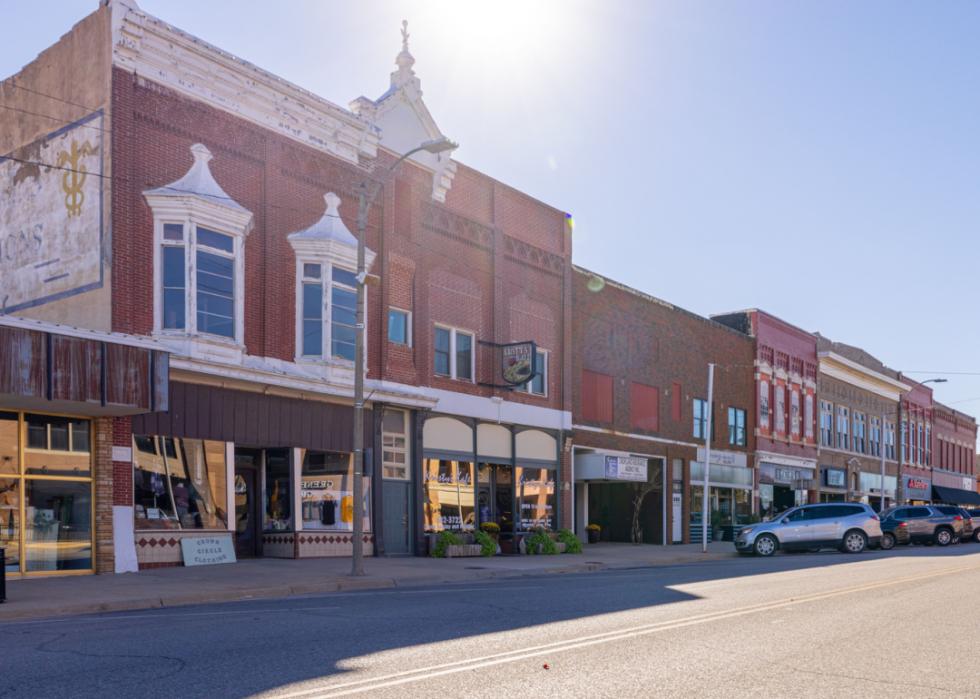
- Death rate for ischemic strokes, 2018-20: 35.0 per 100K people
- Death rate for hemorrhagic strokes, 2018-20: 9.5 per 100K people
You may also like: Counties with the highest rate of food insecure children in Kansas
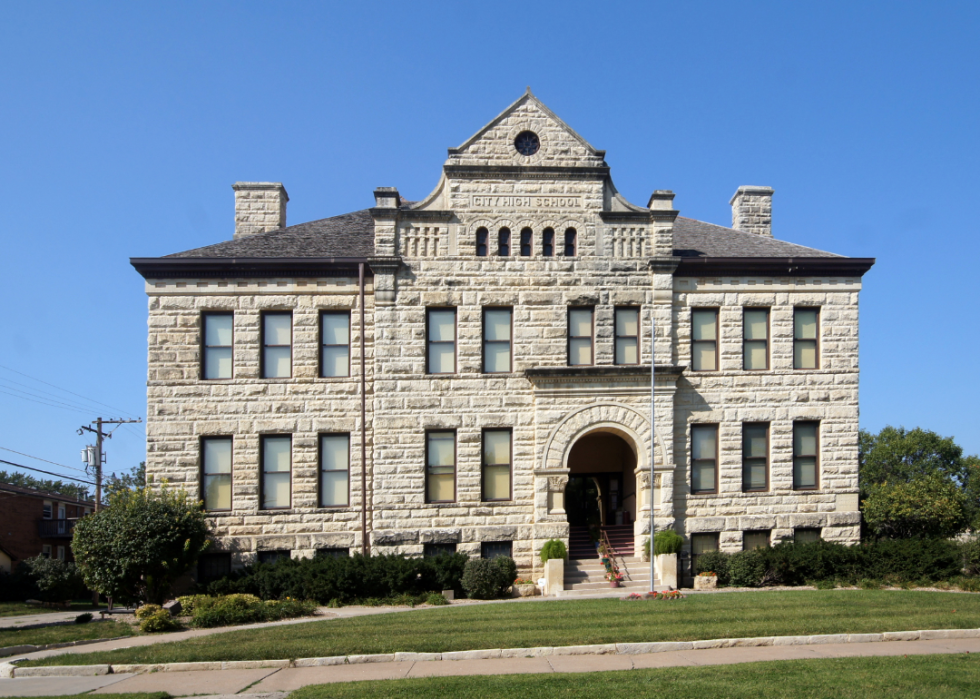
- Death rate for ischemic strokes, 2018-20: 18.5 per 100K people
- Death rate for hemorrhagic strokes, 2018-20: 9.3 per 100K people

- Death rate for ischemic strokes, 2018-20: 21.4 per 100K people
- Death rate for hemorrhagic strokes, 2018-20: 11.1 per 100K people

- Death rate for ischemic strokes, 2018-20: 25.5 per 100K people
- Death rate for hemorrhagic strokes, 2018-20: 10.3 per 100K people

- Death rate for ischemic strokes, 2018-20: 21.8 per 100K people
- Death rate for hemorrhagic strokes, 2018-20: 12.1 per 100K people

- Death rate for ischemic strokes, 2018-20: 21.9 per 100K people
- Death rate for hemorrhagic strokes, 2018-20: 11.2 per 100K people
You may also like: Highest-rated golf courses in Kansas, according to Tripadvisor
This story features data reporting and writing by Emma Rubin and is part of a series utilizing data automation across 49 states.
