Counties with the most bridges in dire need of repair in Kansas
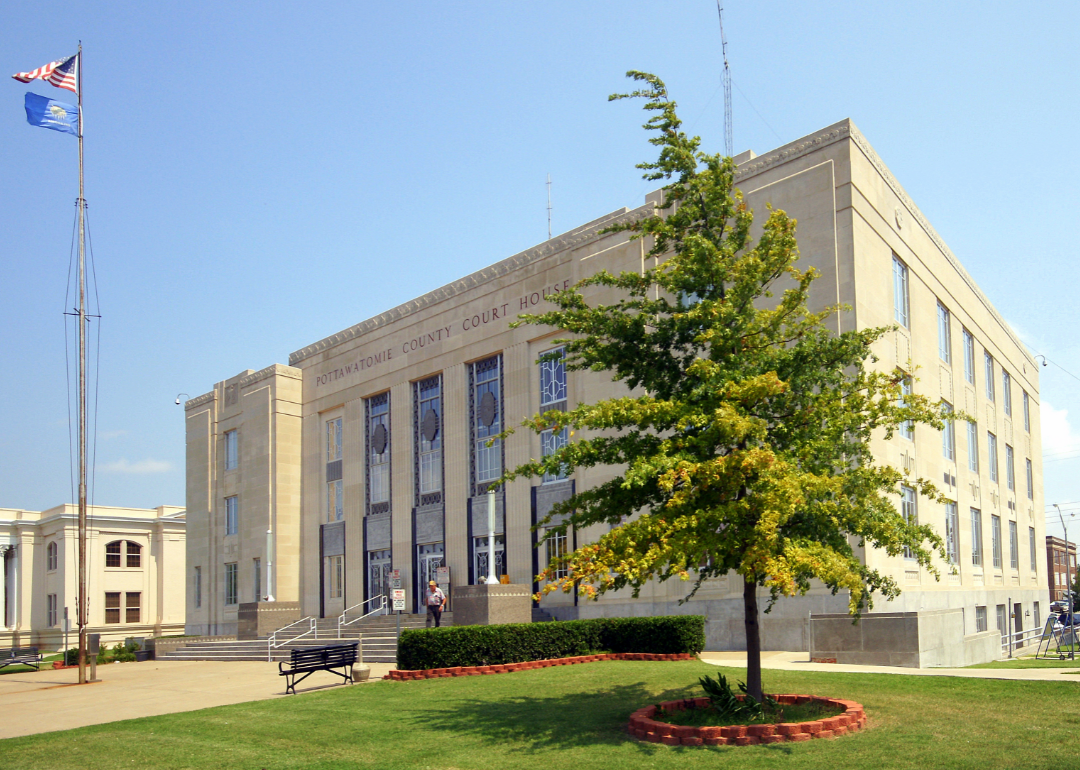
- Bridges in poor condition: 8.6% (26 of 302 bridges)
- Square meters of bridges in poor condition: 11.4% (8,644 of 76,138 square meters of bridges)
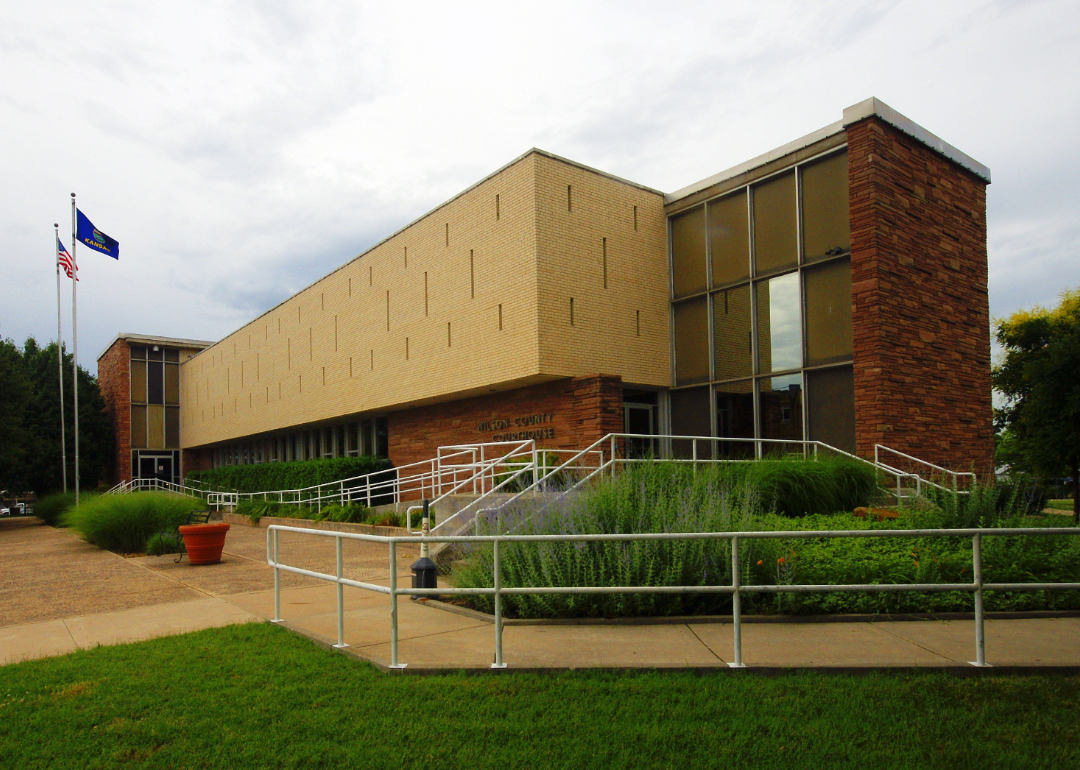
- Bridges in poor condition: 8.8% (18 of 205 bridges)
- Square meters of bridges in poor condition: 2.9% (1,786 of 62,568 square meters of bridges)

- Bridges in poor condition: 9.4% (23 of 245 bridges)
- Square meters of bridges in poor condition: 3.3% (2,271 of 68,782 square meters of bridges)
- Bridges in poor condition: 9.6% (34 of 355 bridges)
- Square meters of bridges in poor condition: 6.3% (3,904 of 62,449 square meters of bridges)
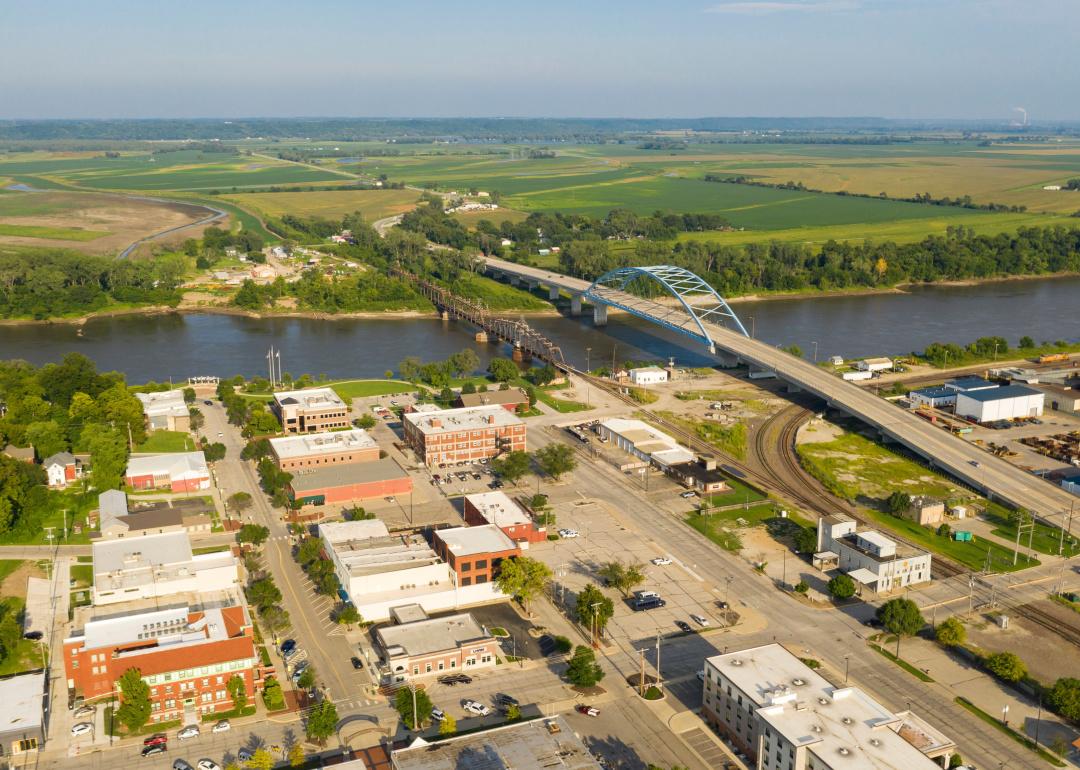
- Bridges in poor condition: 9.6% (19 of 198 bridges)
- Square meters of bridges in poor condition: 3.5% (2,386 of 67,740 square meters of bridges)

- Bridges in poor condition: 9.8% (14 of 143 bridges)
- Square meters of bridges in poor condition: 4.8% (1,551 of 32,369 square meters of bridges)
- Bridges in poor condition: 9.8% (10 of 102 bridges)
- Square meters of bridges in poor condition: 4.7% (1,030 of 22,029 square meters of bridges)

- Bridges in poor condition: 10.0% (16 of 160 bridges)
- Square meters of bridges in poor condition: 3.0% (1,039 of 35,125 square meters of bridges)
- Bridges in poor condition: 10.4% (19 of 182 bridges)
- Square meters of bridges in poor condition: 8.3% (3,143 of 37,888 square meters of bridges)
- Bridges in poor condition: 11.0% (19 of 173 bridges)
- Square meters of bridges in poor condition: 4.5% (1,648 of 36,495 square meters of bridges)
- Bridges in poor condition: 11.0% (25 of 227 bridges)
- Square meters of bridges in poor condition: 2.4% (1,659 of 68,376 square meters of bridges)

- Bridges in poor condition: 11.0% (36 of 326 bridges)
- Square meters of bridges in poor condition: 3.4% (2,277 of 67,224 square meters of bridges)
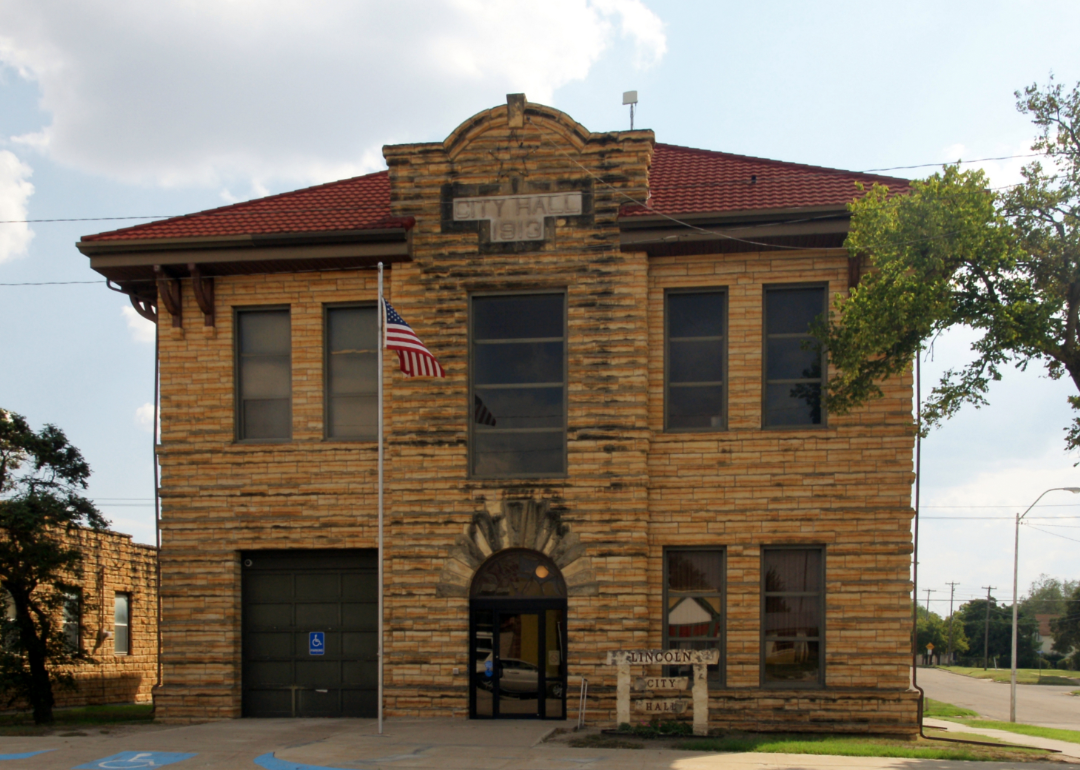
- Bridges in poor condition: 11.5% (27 of 235 bridges)
- Square meters of bridges in poor condition: 4.0% (1,736 of 43,662 square meters of bridges)
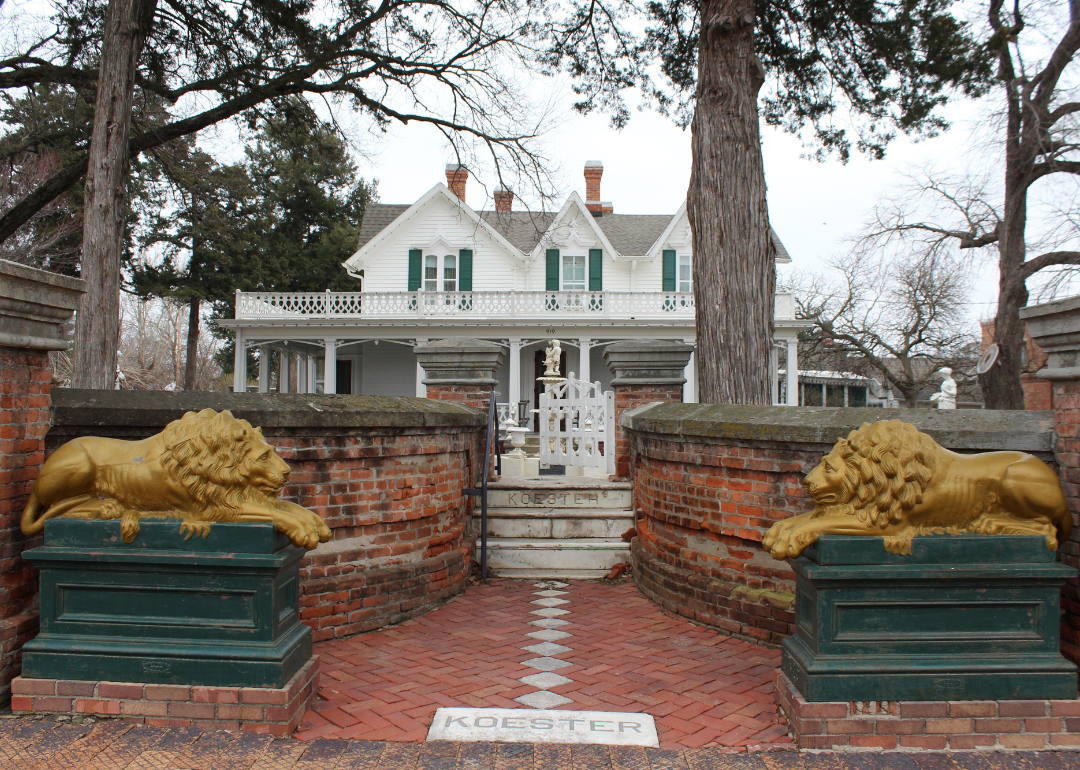
- Bridges in poor condition: 11.6% (47 of 405 bridges)
- Square meters of bridges in poor condition: 7.5% (6,082 of 80,608 square meters of bridges)
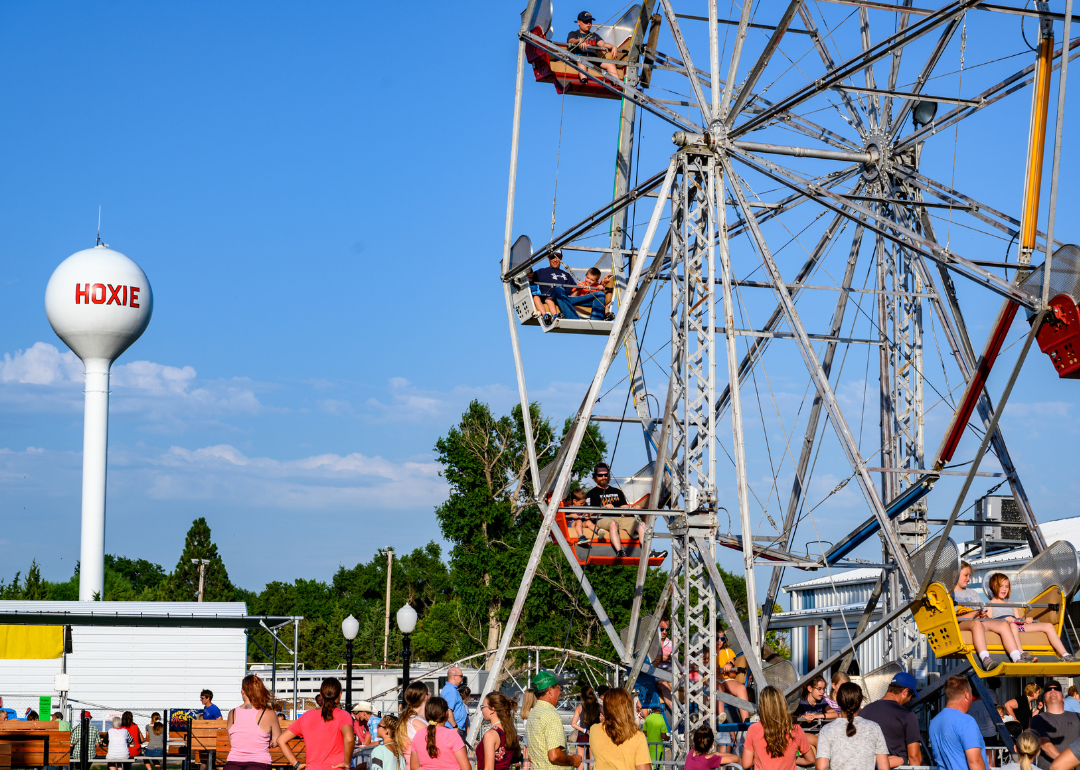
- Bridges in poor condition: 12.5% (15 of 120 bridges)
- Square meters of bridges in poor condition: 9.5% (2,979 of 31,500 square meters of bridges)
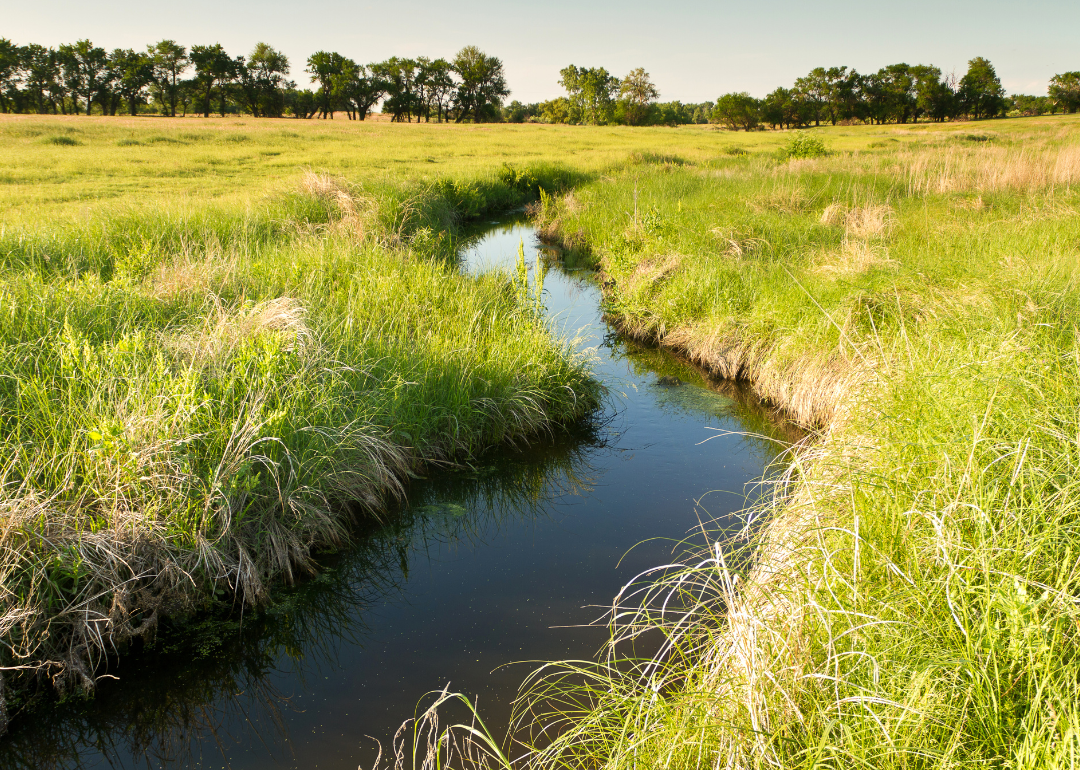
- Bridges in poor condition: 14.0% (40 of 286 bridges)
- Square meters of bridges in poor condition: 7.7% (3,711 of 48,160 square meters of bridges)
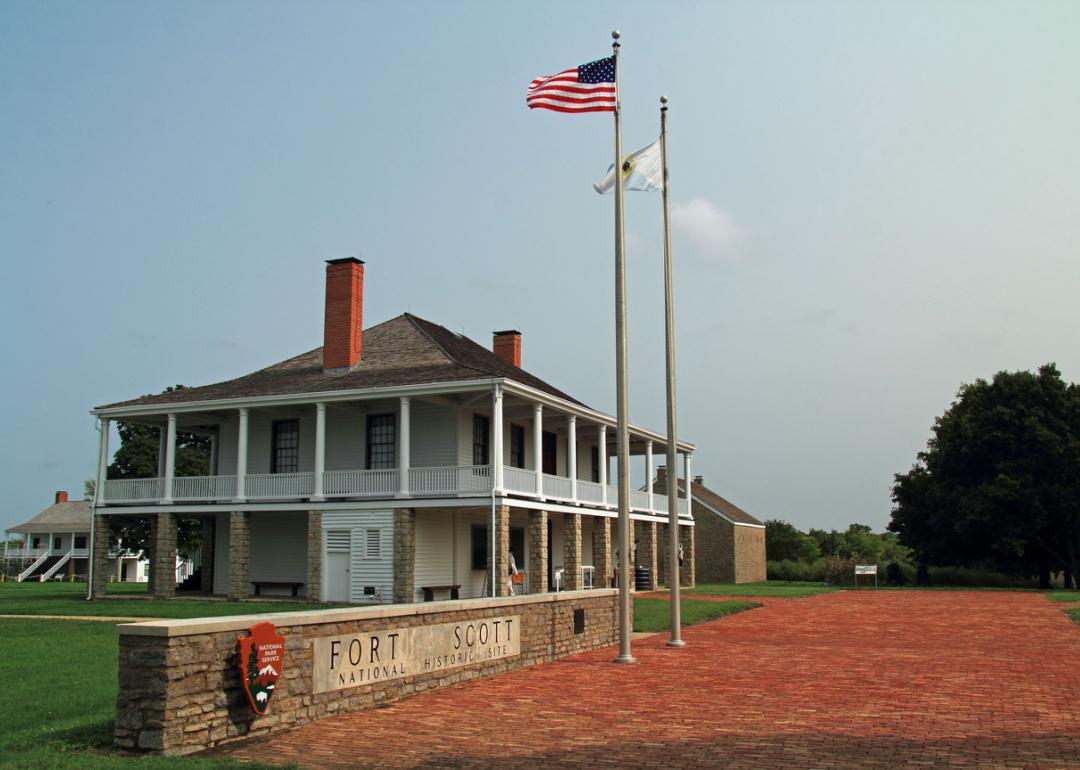
- Bridges in poor condition: 15.0% (31 of 206 bridges)
- Square meters of bridges in poor condition: 4.4% (3,505 of 80,421 square meters of bridges)
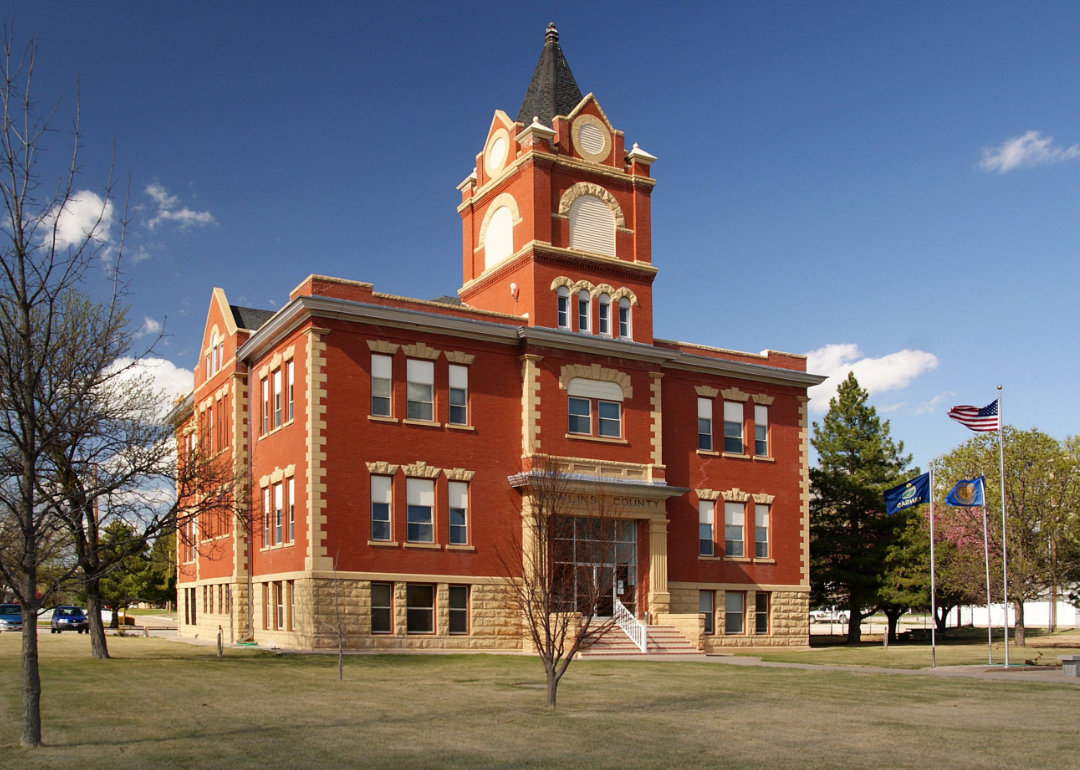
- Bridges in poor condition: 15.4% (16 of 104 bridges)
- Square meters of bridges in poor condition: 7.2% (1,950 of 26,985 square meters of bridges)
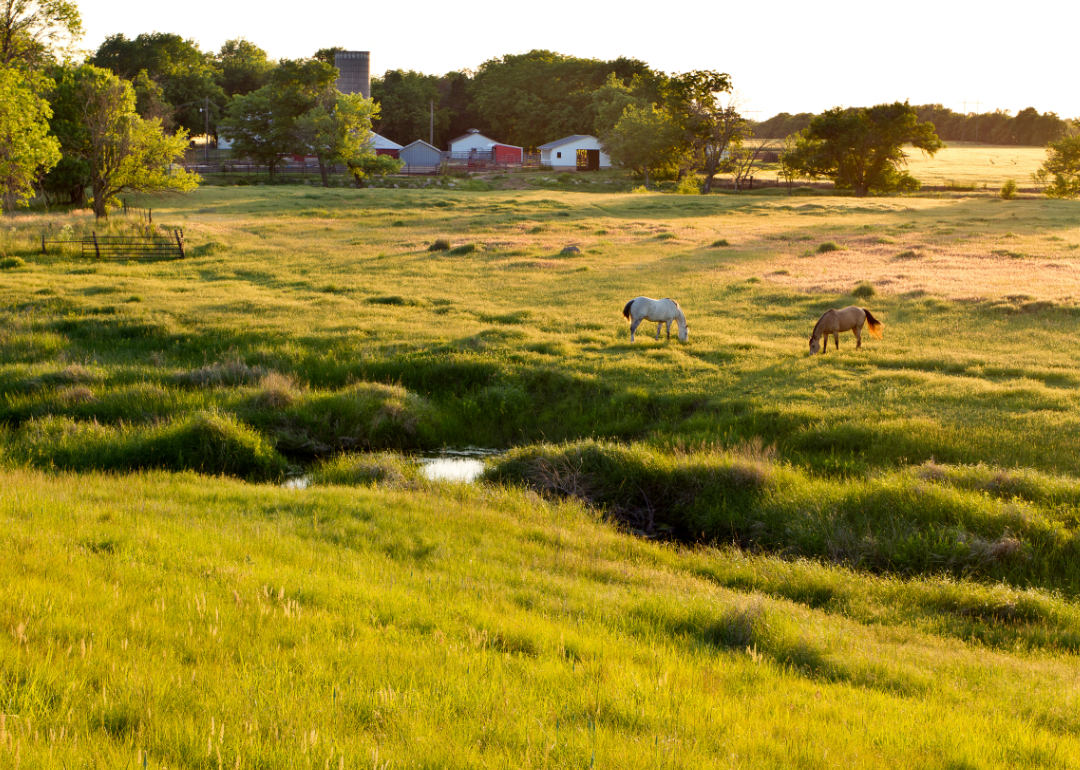
- Bridges in poor condition: 17.3% (44 of 255 bridges)
- Square meters of bridges in poor condition: 7.8% (3,671 of 46,823 square meters of bridges)
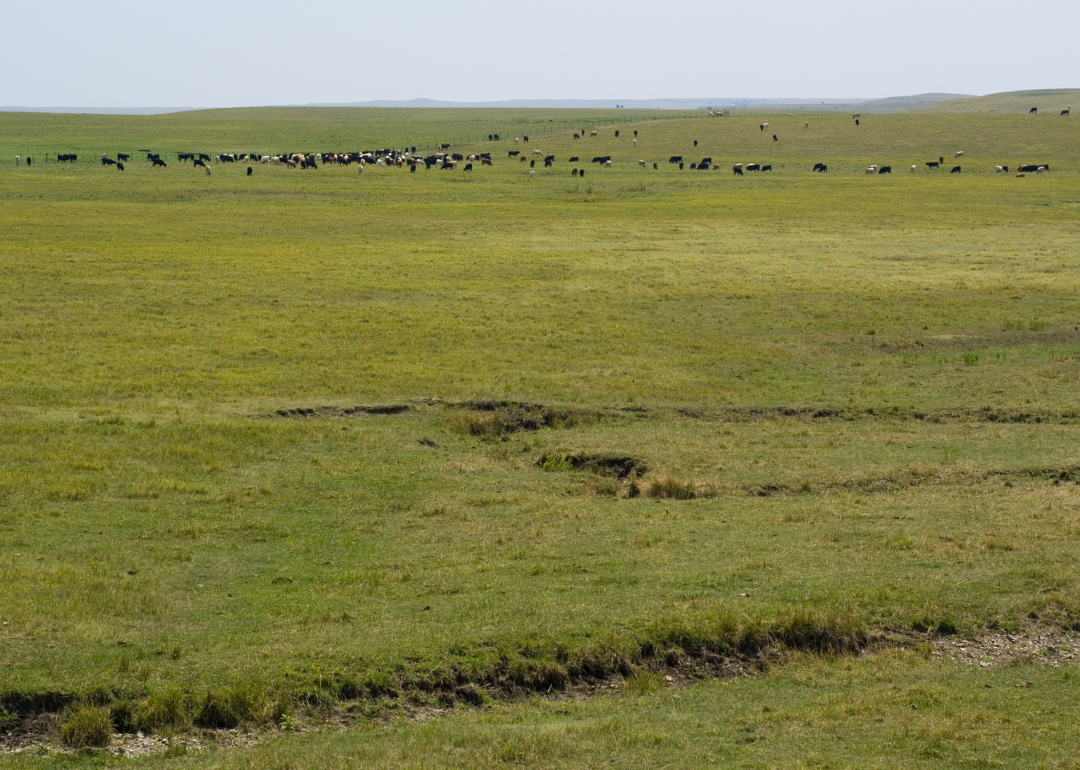
- Bridges in poor condition: 20.4% (48 of 235 bridges)
- Square meters of bridges in poor condition: 11.0% (7,336 of 66,398 square meters of bridges)
