Counties in Ohio with more precipitation over the past year than average
Stacker

photo.ua // Shutterstock
- Precipitation over the past year: 41.2 inches
- Comparison to 1901-2000 average: 0.3 inches above average (#67 rainiest September-August period since 1895)
- Comparison to state's precipitation over past year: 2.9 inches above statewide average
- Comparison to 1901-2000 average: 0.3 inches above average (#67 rainiest September-August period since 1895)
- Comparison to state's precipitation over past year: 2.9 inches above statewide average
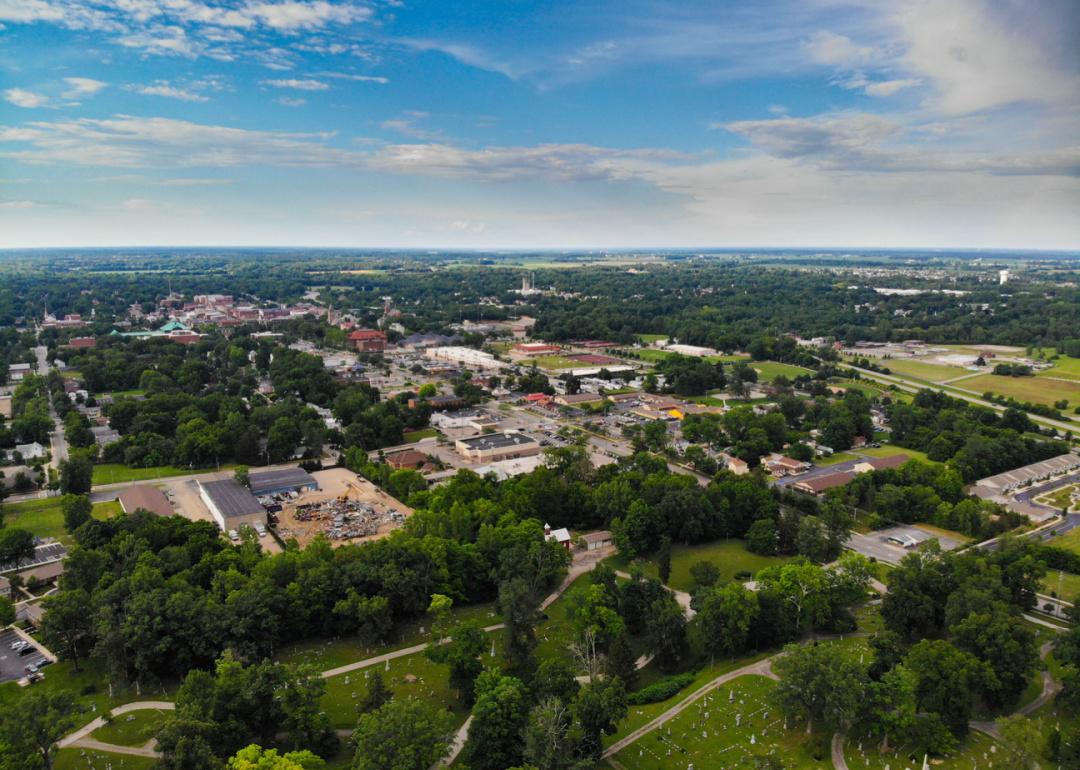
#42. Hamilton County

Kenneth Keifer // Shutterstock
- Precipitation over the past year: 38.3 inches
- Comparison to 1901-2000 average: 0.4 inches above average (#68 rainiest September-August period since 1895)
- Comparison to state's precipitation over past year: 0.0 inches below statewide average
- Comparison to 1901-2000 average: 0.4 inches above average (#68 rainiest September-August period since 1895)
- Comparison to state's precipitation over past year: 0.0 inches below statewide average
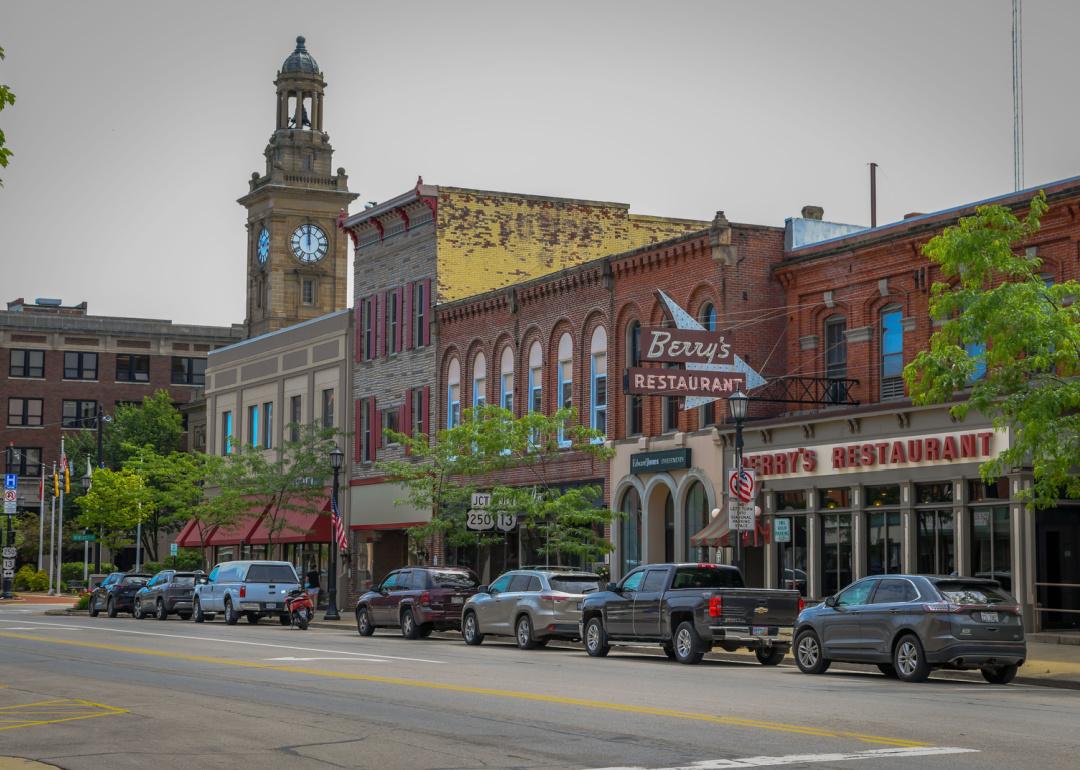
#41. Madison County

Almal3xia // Shutterstock
- Precipitation over the past year: 40.2 inches
- Comparison to 1901-2000 average: 0.5 inches above average (#64 rainiest September-August period since 1895)
- Comparison to state's precipitation over past year: 1.9 inches above statewide average
- Comparison to 1901-2000 average: 0.5 inches above average (#64 rainiest September-August period since 1895)
- Comparison to state's precipitation over past year: 1.9 inches above statewide average
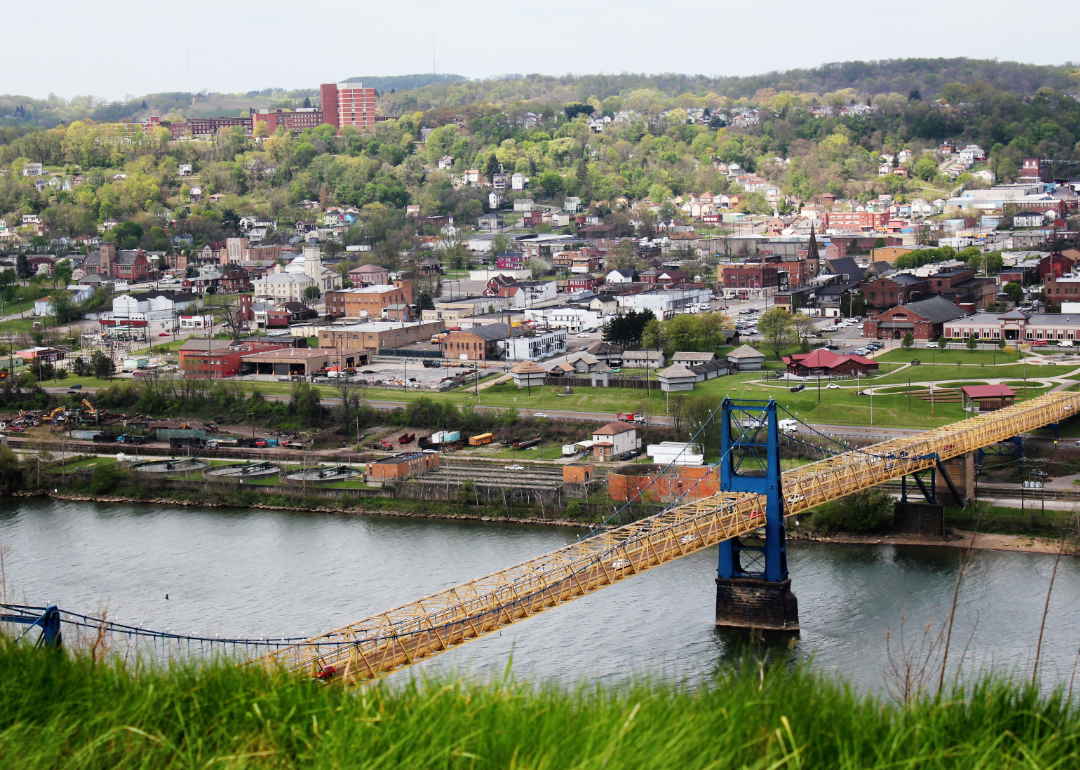
#40. Greene County
Big Joe // Shutterstock
- Precipitation over the past year: 35.2 inches
- Comparison to 1901-2000 average: 0.7 inches above average (#62 rainiest September-August period since 1895)
- Comparison to state's precipitation over past year: 3.0 inches below statewide average
- Comparison to 1901-2000 average: 0.7 inches above average (#62 rainiest September-August period since 1895)
- Comparison to state's precipitation over past year: 3.0 inches below statewide average
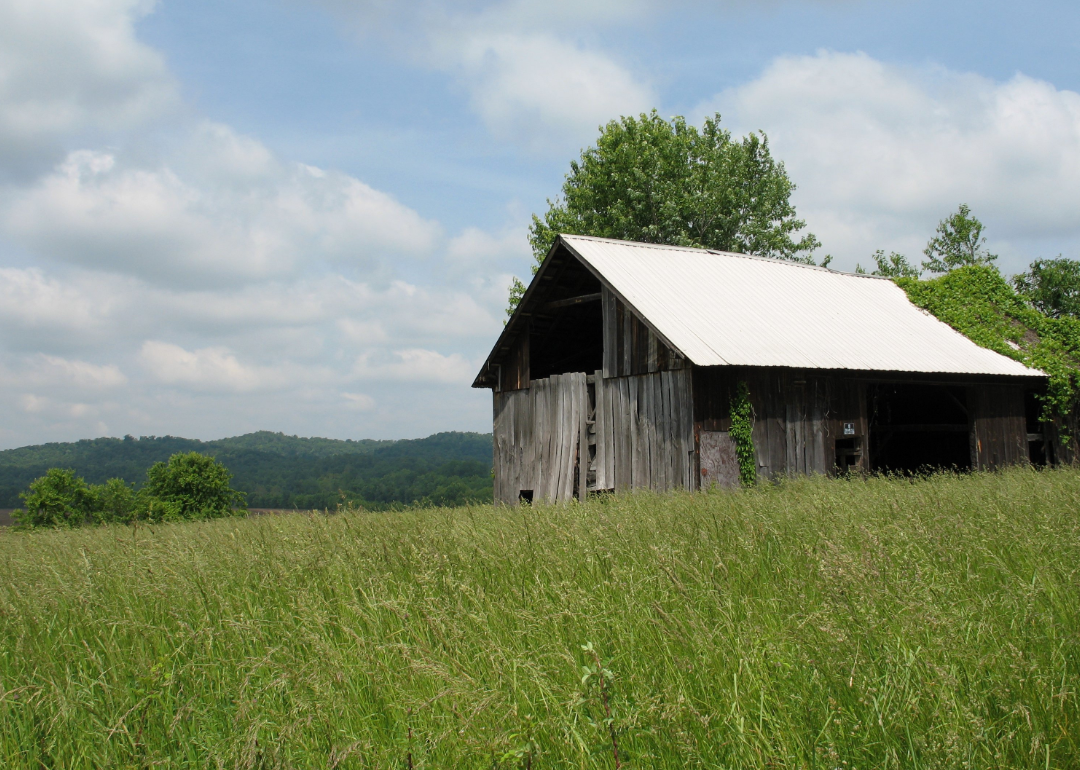
#39. Erie County

Kenneth Keifer // Shutterstock
- Precipitation over the past year: 41.3 inches
- Comparison to 1901-2000 average: 0.7 inches above average (#64 rainiest September-August period since 1895)
- Comparison to state's precipitation over past year: 3.0 inches above statewide average
- Comparison to 1901-2000 average: 0.7 inches above average (#64 rainiest September-August period since 1895)
- Comparison to state's precipitation over past year: 3.0 inches above statewide average
#38. Noble County

Showcase Imaging // Shutterstock
- Precipitation over the past year: 36.9 inches
- Comparison to 1901-2000 average: 0.8 inches above average (#71 rainiest September-August period since 1895)
- Comparison to state's precipitation over past year: 1.3 inches below statewide average
- Comparison to 1901-2000 average: 0.8 inches above average (#71 rainiest September-August period since 1895)
- Comparison to state's precipitation over past year: 1.3 inches below statewide average
#37. Summit County
Canva
- Precipitation over the past year: 37.3 inches
- Comparison to 1901-2000 average: 0.8 inches above average (#72 rainiest September-August period since 1895)
- Comparison to state's precipitation over past year: 1.0 inches below statewide average
- Comparison to 1901-2000 average: 0.8 inches above average (#72 rainiest September-August period since 1895)
- Comparison to state's precipitation over past year: 1.0 inches below statewide average
#36. Logan County

Sean Pavone // Shutterstock
- Precipitation over the past year: 39.3 inches
- Comparison to 1901-2000 average: 1.0 inches above average (#57 rainiest September-August period since 1895)
- Comparison to state's precipitation over past year: 1.1 inches above statewide average
- Comparison to 1901-2000 average: 1.0 inches above average (#57 rainiest September-August period since 1895)
- Comparison to state's precipitation over past year: 1.1 inches above statewide average
#35. Franklin County

Kenneth Sponsler // Shutterstock
- Precipitation over the past year: 40.8 inches
- Comparison to 1901-2000 average: 1.1 inches above average (#56 rainiest September-August period since 1895)
- Comparison to state's precipitation over past year: 2.5 inches above statewide average
- Comparison to 1901-2000 average: 1.1 inches above average (#56 rainiest September-August period since 1895)
- Comparison to state's precipitation over past year: 2.5 inches above statewide average
#34. Licking County
Canva
- Precipitation over the past year: 41.9 inches
- Comparison to 1901-2000 average: 1.1 inches above average (#59 rainiest September-August period since 1895)
- Comparison to state's precipitation over past year: 3.7 inches above statewide average
- Comparison to 1901-2000 average: 1.1 inches above average (#59 rainiest September-August period since 1895)
- Comparison to state's precipitation over past year: 3.7 inches above statewide average
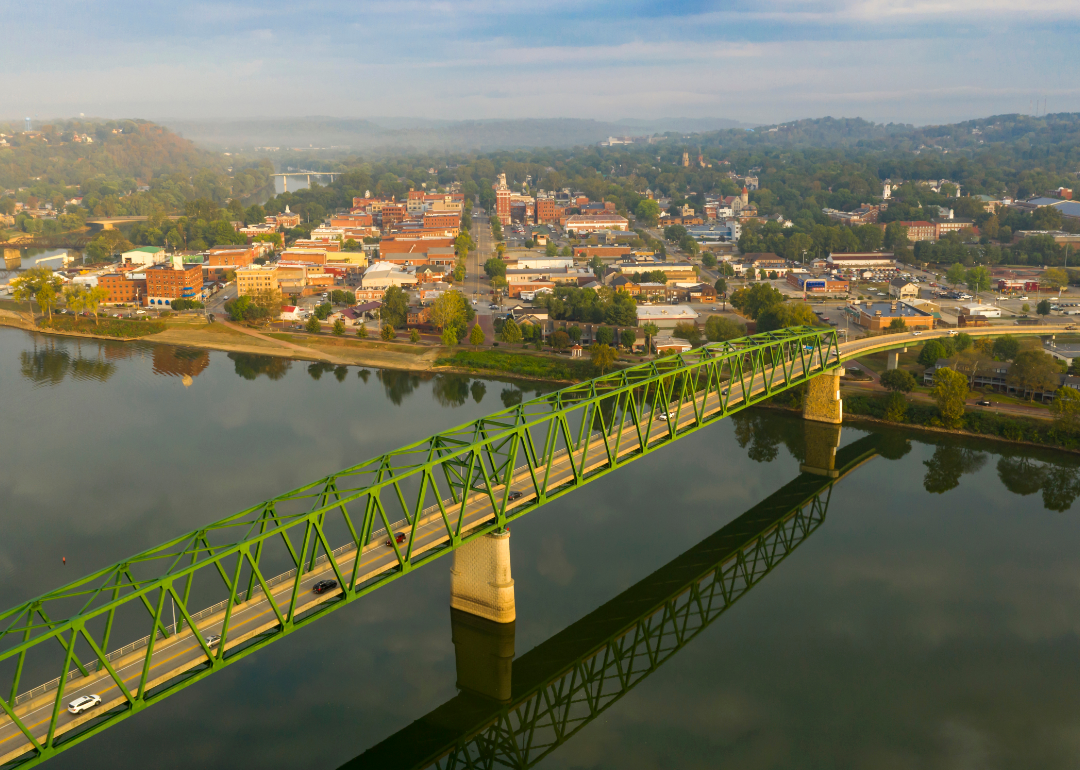
#33. Washington County

Kenneth Sponsler // Shutterstock
- Precipitation over the past year: 37.3 inches
- Comparison to 1901-2000 average: 1.2 inches above average (#63 rainiest September-August period since 1895)
- Comparison to state's precipitation over past year: 1.0 inches below statewide average
- Comparison to 1901-2000 average: 1.2 inches above average (#63 rainiest September-August period since 1895)
- Comparison to state's precipitation over past year: 1.0 inches below statewide average
#32. Medina County

JNix // Shutterstock
- Precipitation over the past year: 42.1 inches
- Comparison to 1901-2000 average: 1.2 inches above average (#53 rainiest September-August period since 1895)
- Comparison to state's precipitation over past year: 3.8 inches above statewide average
- Comparison to 1901-2000 average: 1.2 inches above average (#53 rainiest September-August period since 1895)
- Comparison to state's precipitation over past year: 3.8 inches above statewide average
#31. Belmont County
Canva
- Precipitation over the past year: 37.8 inches
- Comparison to 1901-2000 average: 1.3 inches above average (#56 rainiest September-August period since 1895)
- Comparison to state's precipitation over past year: 0.5 inches below statewide average
- Comparison to 1901-2000 average: 1.3 inches above average (#56 rainiest September-August period since 1895)
- Comparison to state's precipitation over past year: 0.5 inches below statewide average
#30. Wayne County
dvgpro // Shutterstock
- Precipitation over the past year: 39.3 inches
- Comparison to 1901-2000 average: 1.4 inches above average (#58 rainiest September-August period since 1895)
- Comparison to state's precipitation over past year: 1.0 inches above statewide average
- Comparison to 1901-2000 average: 1.4 inches above average (#58 rainiest September-August period since 1895)
- Comparison to state's precipitation over past year: 1.0 inches above statewide average
#29. Delaware County
Keith J Finks // Shutterstock
- Precipitation over the past year: 37.4 inches
- Comparison to 1901-2000 average: 1.4 inches above average (#57 rainiest September-August period since 1895)
- Comparison to state's precipitation over past year: 0.9 inches below statewide average
- Comparison to 1901-2000 average: 1.4 inches above average (#57 rainiest September-August period since 1895)
- Comparison to state's precipitation over past year: 0.9 inches below statewide average
#28. Huron County
Canva
- Precipitation over the past year: 40.4 inches
- Comparison to 1901-2000 average: 1.6 inches above average (#54 rainiest September-August period since 1895)
- Comparison to state's precipitation over past year: 2.1 inches above statewide average
- Comparison to 1901-2000 average: 1.6 inches above average (#54 rainiest September-August period since 1895)
- Comparison to state's precipitation over past year: 2.1 inches above statewide average
#27. Jefferson County

Canva
- Precipitation over the past year: 39.4 inches
- Comparison to 1901-2000 average: 1.9 inches above average (#53 rainiest September-August period since 1895)
- Comparison to state's precipitation over past year: 1.1 inches above statewide average
- Comparison to 1901-2000 average: 1.9 inches above average (#53 rainiest September-August period since 1895)
- Comparison to state's precipitation over past year: 1.1 inches above statewide average
#26. Crawford County

Canva
- Precipitation over the past year: 42.5 inches
- Comparison to 1901-2000 average: 1.9 inches above average (#57 rainiest September-August period since 1895)
- Comparison to state's precipitation over past year: 4.2 inches above statewide average
- Comparison to 1901-2000 average: 1.9 inches above average (#57 rainiest September-August period since 1895)
- Comparison to state's precipitation over past year: 4.2 inches above statewide average
#25. Butler County
Canva
- Precipitation over the past year: 39.9 inches
- Comparison to 1901-2000 average: 1.9 inches above average (#58 rainiest September-August period since 1895)
- Comparison to state's precipitation over past year: 1.6 inches above statewide average
- Comparison to 1901-2000 average: 1.9 inches above average (#58 rainiest September-August period since 1895)
- Comparison to state's precipitation over past year: 1.6 inches above statewide average
#24. Champaign County
James Marciniak // Shutterstock
- Precipitation over the past year: 40.8 inches
- Comparison to 1901-2000 average: 2.1 inches above average (#56 rainiest September-August period since 1895)
- Comparison to state's precipitation over past year: 2.5 inches above statewide average
- Comparison to 1901-2000 average: 2.1 inches above average (#56 rainiest September-August period since 1895)
- Comparison to state's precipitation over past year: 2.5 inches above statewide average
#23. Clark County

BLAZE Pro // Shutterstock
- Precipitation over the past year: 39.5 inches
- Comparison to 1901-2000 average: 2.2 inches above average (#51 rainiest September-August period since 1895)
- Comparison to state's precipitation over past year: 1.3 inches above statewide average
- Comparison to 1901-2000 average: 2.2 inches above average (#51 rainiest September-August period since 1895)
- Comparison to state's precipitation over past year: 1.3 inches above statewide average
#22. Stark County
Lake Front Drones // Shutterstock
- Precipitation over the past year: 36.9 inches
- Comparison to 1901-2000 average: 2.2 inches above average (#54 rainiest September-August period since 1895)
- Comparison to state's precipitation over past year: 1.4 inches below statewide average
- Comparison to 1901-2000 average: 2.2 inches above average (#54 rainiest September-August period since 1895)
- Comparison to state's precipitation over past year: 1.4 inches below statewide average
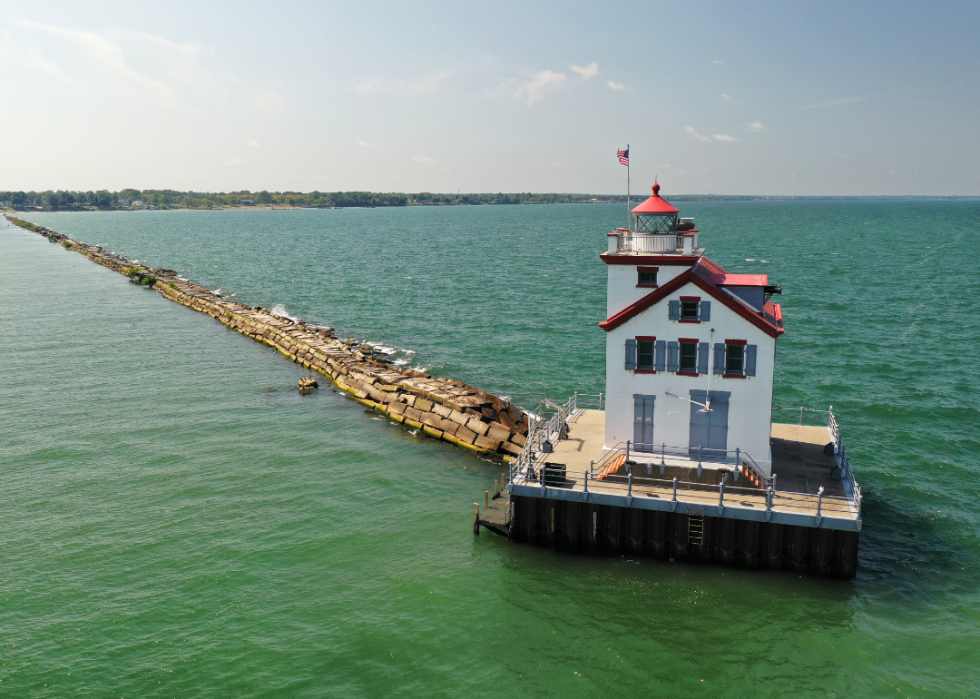
#21. Lorain County
Canva
- Precipitation over the past year: 41.4 inches
- Comparison to 1901-2000 average: 2.3 inches above average (#52 rainiest September-August period since 1895)
- Comparison to state's precipitation over past year: 3.1 inches above statewide average
- Comparison to 1901-2000 average: 2.3 inches above average (#52 rainiest September-August period since 1895)
- Comparison to state's precipitation over past year: 3.1 inches above statewide average
#20. Muskingum County
Canva
- Precipitation over the past year: 39.6 inches
- Comparison to 1901-2000 average: 2.4 inches above average (#44 rainiest September-August period since 1895)
- Comparison to state's precipitation over past year: 1.3 inches above statewide average
- Comparison to 1901-2000 average: 2.4 inches above average (#44 rainiest September-August period since 1895)
- Comparison to state's precipitation over past year: 1.3 inches above statewide average
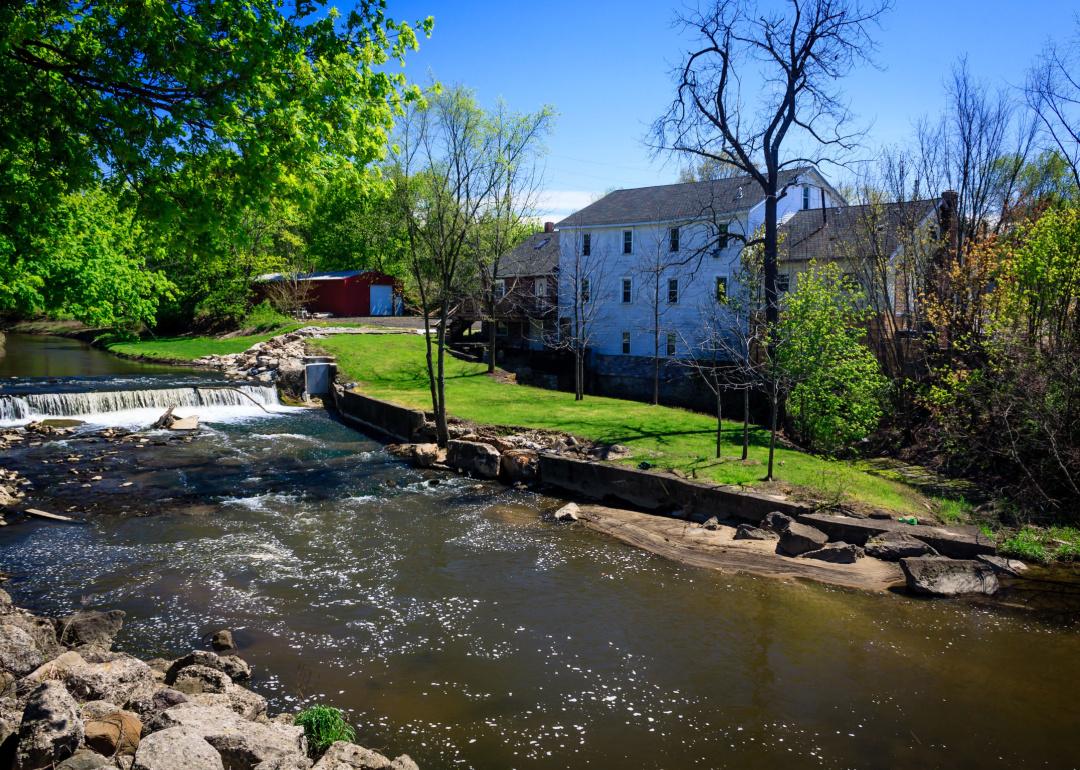
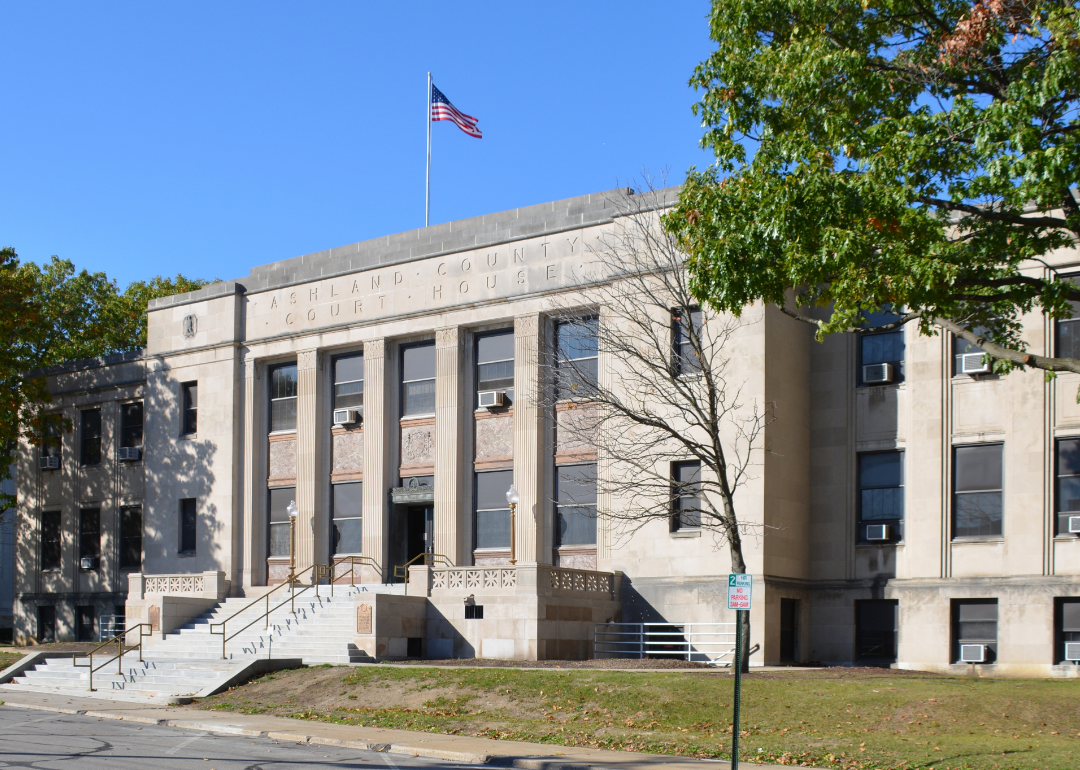
#19. Ashland County

Canva
- Precipitation over the past year: 42.1 inches
- Comparison to 1901-2000 average: 2.7 inches above average (#43 rainiest September-August period since 1895)
- Comparison to state's precipitation over past year: 3.8 inches above statewide average
- Comparison to 1901-2000 average: 2.7 inches above average (#43 rainiest September-August period since 1895)
- Comparison to state's precipitation over past year: 3.8 inches above statewide average
#18. Guernsey County
redtbird02 // Shutterstock
- Precipitation over the past year: 42.5 inches
- Comparison to 1901-2000 average: 2.9 inches above average (#45 rainiest September-August period since 1895)
- Comparison to state's precipitation over past year: 4.2 inches above statewide average
- Comparison to 1901-2000 average: 2.9 inches above average (#45 rainiest September-August period since 1895)
- Comparison to state's precipitation over past year: 4.2 inches above statewide average
#17. Ashtabula County

Canva
- Precipitation over the past year: 42.2 inches
- Comparison to 1901-2000 average: 3.0 inches above average (#42 rainiest September-August period since 1895)
- Comparison to state's precipitation over past year: 3.9 inches above statewide average
- Comparison to 1901-2000 average: 3.0 inches above average (#42 rainiest September-August period since 1895)
- Comparison to state's precipitation over past year: 3.9 inches above statewide average
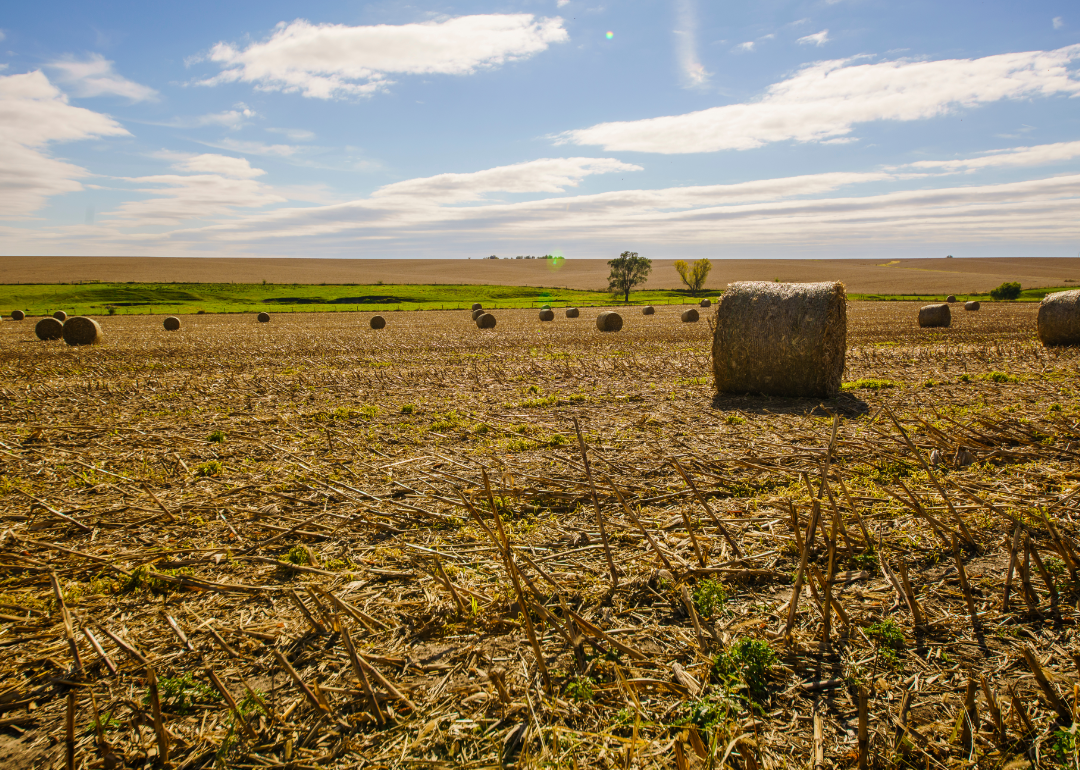
#16. Morrow County

Madison Muskopf // Shutterstock
- Precipitation over the past year: 42.0 inches
- Comparison to 1901-2000 average: 3.2 inches above average (#41 rainiest September-August period since 1895)
- Comparison to state's precipitation over past year: 3.7 inches above statewide average
- Comparison to 1901-2000 average: 3.2 inches above average (#41 rainiest September-August period since 1895)
- Comparison to state's precipitation over past year: 3.7 inches above statewide average
#15. Coshocton County
JNix // Shutterstock
- Precipitation over the past year: 42.6 inches
- Comparison to 1901-2000 average: 3.2 inches above average (#38 rainiest September-August period since 1895)
- Comparison to state's precipitation over past year: 4.4 inches above statewide average
- Comparison to 1901-2000 average: 3.2 inches above average (#38 rainiest September-August period since 1895)
- Comparison to state's precipitation over past year: 4.4 inches above statewide average
#14. Harrison County

Canva
- Precipitation over the past year: 40.5 inches
- Comparison to 1901-2000 average: 3.3 inches above average (#42 rainiest September-August period since 1895)
- Comparison to state's precipitation over past year: 2.3 inches above statewide average
- Comparison to 1901-2000 average: 3.3 inches above average (#42 rainiest September-August period since 1895)
- Comparison to state's precipitation over past year: 2.3 inches above statewide average
#13. Mahoning County
Canva
- Precipitation over the past year: 41.6 inches
- Comparison to 1901-2000 average: 3.4 inches above average (#39 rainiest September-August period since 1895)
- Comparison to state's precipitation over past year: 3.3 inches above statewide average
- Comparison to 1901-2000 average: 3.4 inches above average (#39 rainiest September-August period since 1895)
- Comparison to state's precipitation over past year: 3.3 inches above statewide average
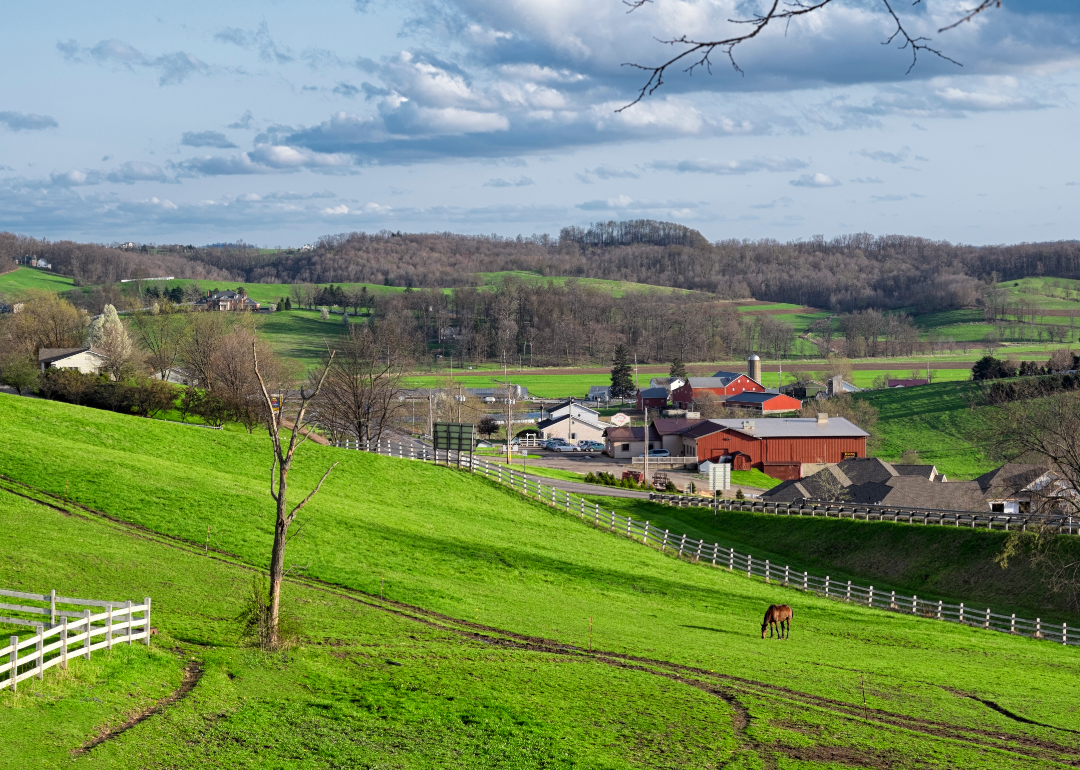
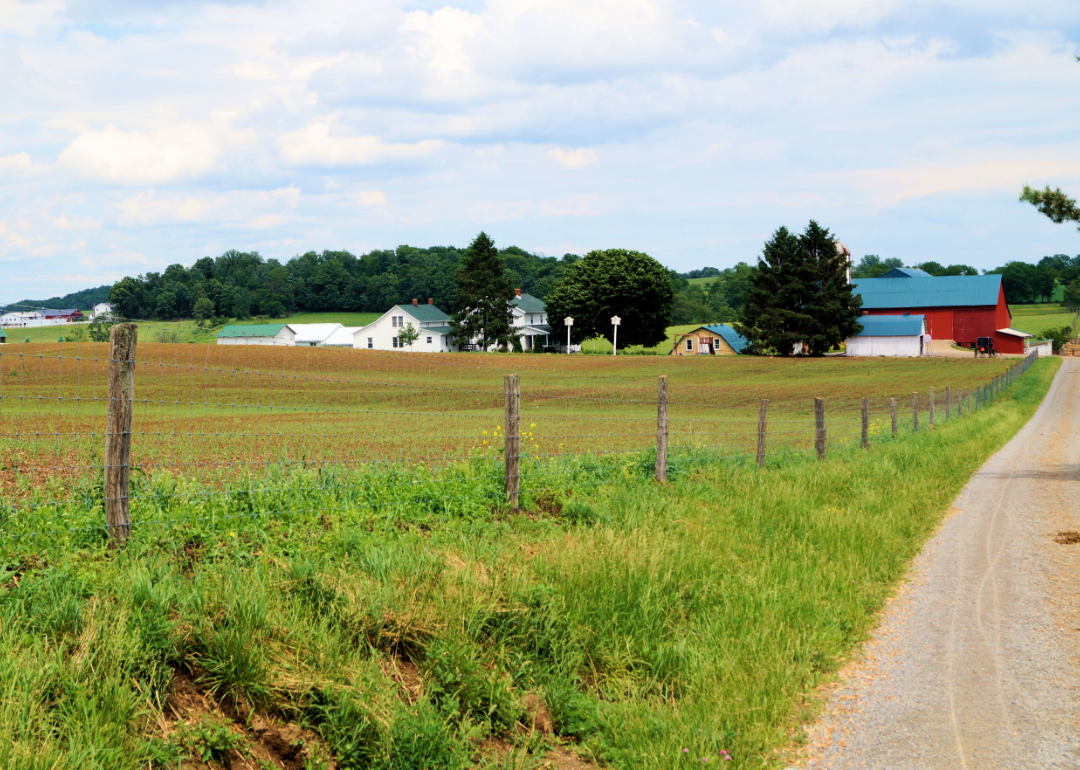
#12. Holmes County

jul11h // Shutterstock
- Precipitation over the past year: 40.6 inches
- Comparison to 1901-2000 average: 3.6 inches above average (#39 rainiest September-August period since 1895)
- Comparison to state's precipitation over past year: 2.4 inches above statewide average
- Comparison to 1901-2000 average: 3.6 inches above average (#39 rainiest September-August period since 1895)
- Comparison to state's precipitation over past year: 2.4 inches above statewide average
#11. Portage County

Canva
- Precipitation over the past year: 46.2 inches
- Comparison to 1901-2000 average: 3.9 inches above average (#40 rainiest September-August period since 1895)
- Comparison to state's precipitation over past year: 7.9 inches above statewide average
- Comparison to 1901-2000 average: 3.9 inches above average (#40 rainiest September-August period since 1895)
- Comparison to state's precipitation over past year: 7.9 inches above statewide average
#10. Monroe County

Donna Wickerham // Shutterstock
- Precipitation over the past year: 42.0 inches
- Comparison to 1901-2000 average: 3.9 inches above average (#32 rainiest September-August period since 1895)
- Comparison to state's precipitation over past year: 3.8 inches above statewide average
- Comparison to 1901-2000 average: 3.9 inches above average (#32 rainiest September-August period since 1895)
- Comparison to state's precipitation over past year: 3.8 inches above statewide average
#9. Richland County

Canva
- Precipitation over the past year: 41.8 inches
- Comparison to 1901-2000 average: 4.1 inches above average (#35 rainiest September-August period since 1895)
- Comparison to state's precipitation over past year: 3.5 inches above statewide average
- Comparison to 1901-2000 average: 4.1 inches above average (#35 rainiest September-August period since 1895)
- Comparison to state's precipitation over past year: 3.5 inches above statewide average
#8. Trumbull County

JNix // Shutterstock
- Precipitation over the past year: 42.4 inches
- Comparison to 1901-2000 average: 4.4 inches above average (#28 rainiest September-August period since 1895)
- Comparison to state's precipitation over past year: 4.1 inches above statewide average
- Comparison to 1901-2000 average: 4.4 inches above average (#28 rainiest September-August period since 1895)
- Comparison to state's precipitation over past year: 4.1 inches above statewide average
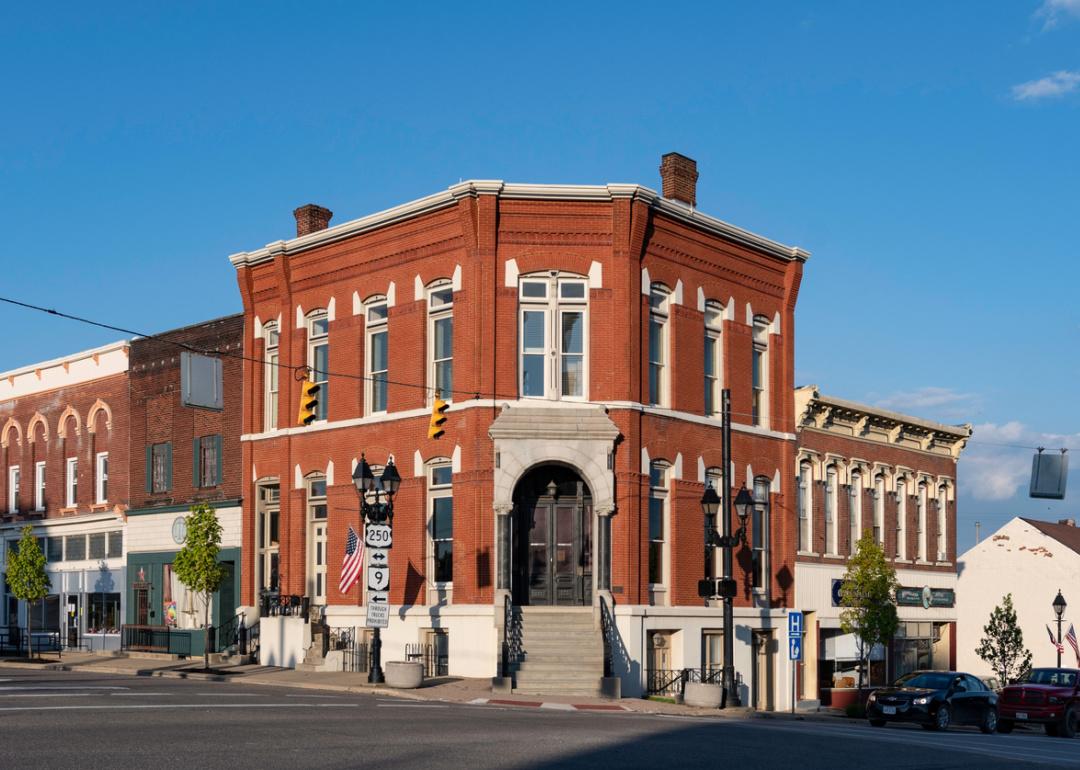
#7. Columbiana County

Kenneth Keifer // Shutterstock
- Precipitation over the past year: 44.0 inches
- Comparison to 1901-2000 average: 4.6 inches above average (#29 rainiest September-August period since 1895)
- Comparison to state's precipitation over past year: 5.7 inches above statewide average
- Comparison to 1901-2000 average: 4.6 inches above average (#29 rainiest September-August period since 1895)
- Comparison to state's precipitation over past year: 5.7 inches above statewide average
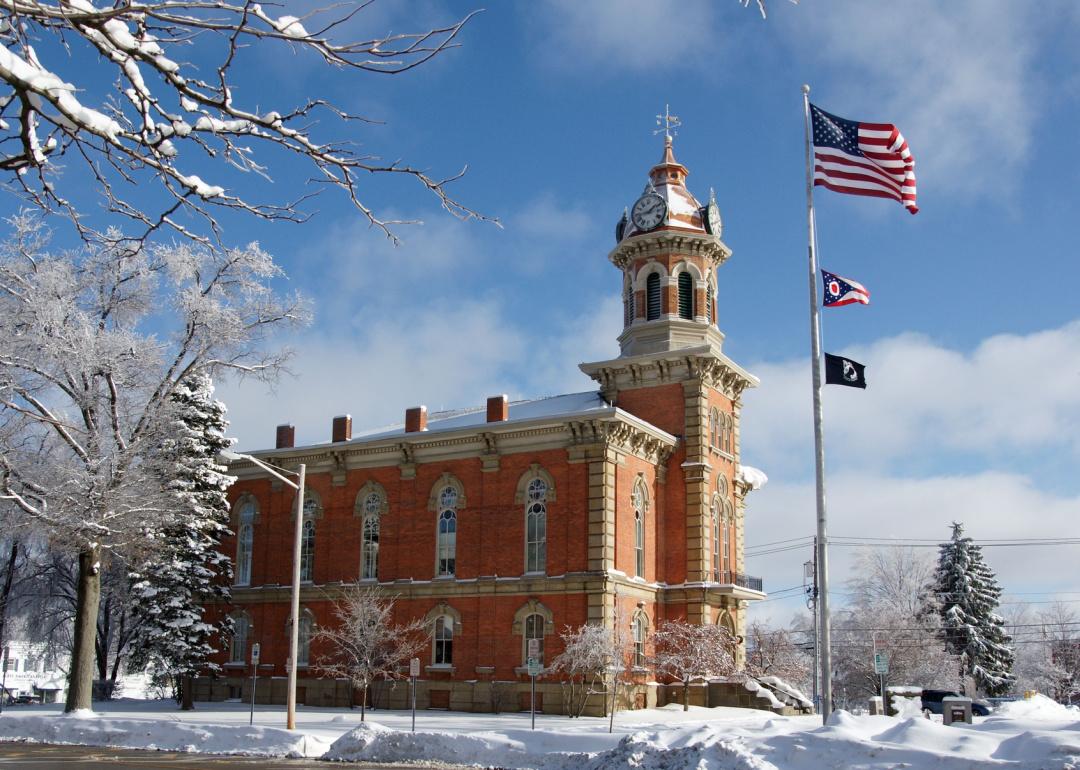
#6. Knox County

Aiwilliams // Shutterstock
- Precipitation over the past year: 43.5 inches
- Comparison to 1901-2000 average: 4.7 inches above average (#28 rainiest September-August period since 1895)
- Comparison to state's precipitation over past year: 5.2 inches above statewide average
- Comparison to 1901-2000 average: 4.7 inches above average (#28 rainiest September-August period since 1895)
- Comparison to state's precipitation over past year: 5.2 inches above statewide average
#5. Carroll County

BLAZE Pro // Shutterstock
- Precipitation over the past year: 43.8 inches
- Comparison to 1901-2000 average: 5.3 inches above average (#23 rainiest September-August period since 1895)
- Comparison to state's precipitation over past year: 5.5 inches above statewide average
- Comparison to 1901-2000 average: 5.3 inches above average (#23 rainiest September-August period since 1895)
- Comparison to state's precipitation over past year: 5.5 inches above statewide average
#4. Tuscarawas County

Canva
- Precipitation over the past year: 43.0 inches
- Comparison to 1901-2000 average: 7.2 inches above average (#11 rainiest September-August period since 1895)
- Comparison to state's precipitation over past year: 4.8 inches above statewide average
- Comparison to 1901-2000 average: 7.2 inches above average (#11 rainiest September-August period since 1895)
- Comparison to state's precipitation over past year: 4.8 inches above statewide average
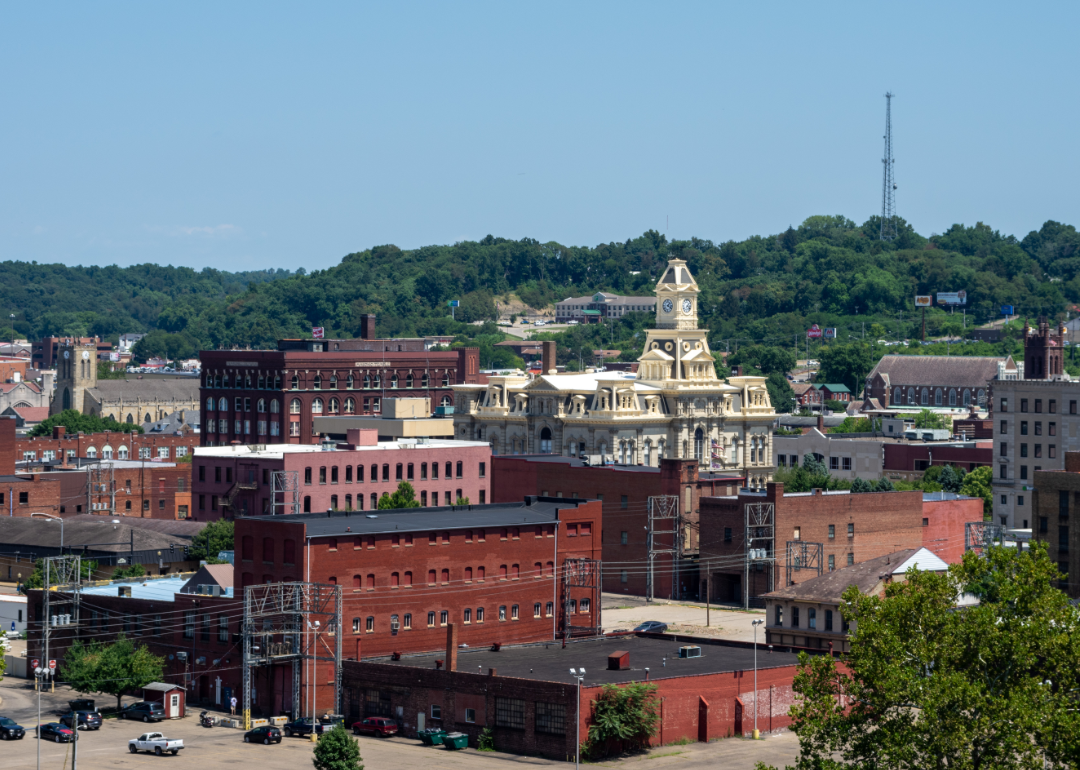
#3. Cuyahoga County
Susie Prentice // Shutterstock
- Precipitation over the past year: 46.8 inches
- Comparison to 1901-2000 average: 8.1 inches above average (#13 rainiest September-August period since 1895)
- Comparison to state's precipitation over past year: 8.5 inches above statewide average
- Comparison to 1901-2000 average: 8.1 inches above average (#13 rainiest September-August period since 1895)
- Comparison to state's precipitation over past year: 8.5 inches above statewide average
#2. Geauga County
Mikhalis Makarov // Shutterstock
- Precipitation over the past year: 46.8 inches
- Comparison to 1901-2000 average: 9.3 inches above average (#9 rainiest September-August period since 1895)
- Comparison to state's precipitation over past year: 8.5 inches above statewide average
- Comparison to 1901-2000 average: 9.3 inches above average (#9 rainiest September-August period since 1895)
- Comparison to state's precipitation over past year: 8.5 inches above statewide average
This story features data reporting and writing by Emma Rubin, and is part of a series utilizing data automation across 44 states.
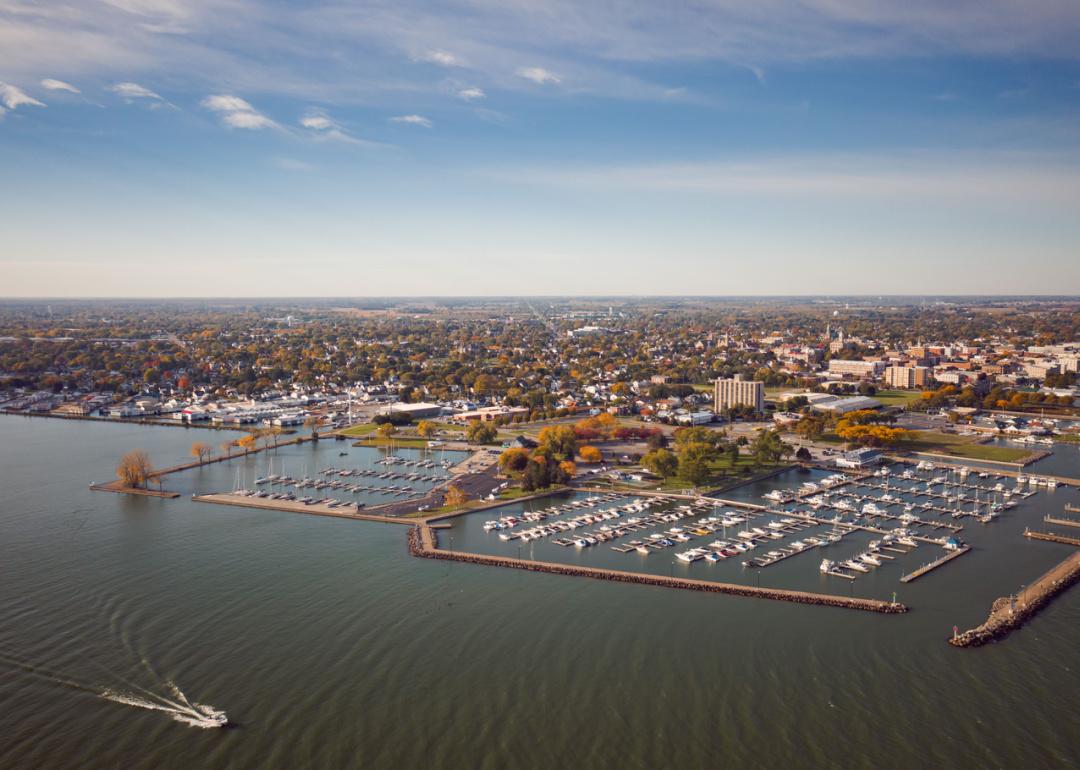
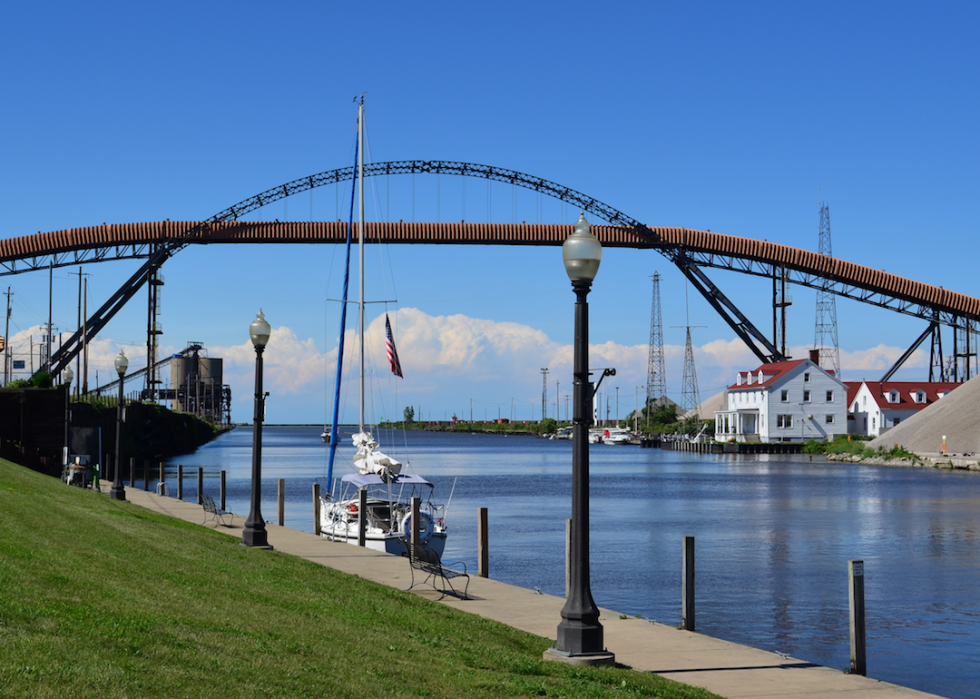
#1. Lake County
ND700 // Shutterstock