Counties with the most tornadoes in South Dakota
Stacker
Canva
- Tornadoes since 2000: 6 (0.39 per 100 square miles)
- #2,003 nationally
- Tornadoes this year, as of May 31: 0
- #2,003 nationally
- Tornadoes this year, as of May 31: 0
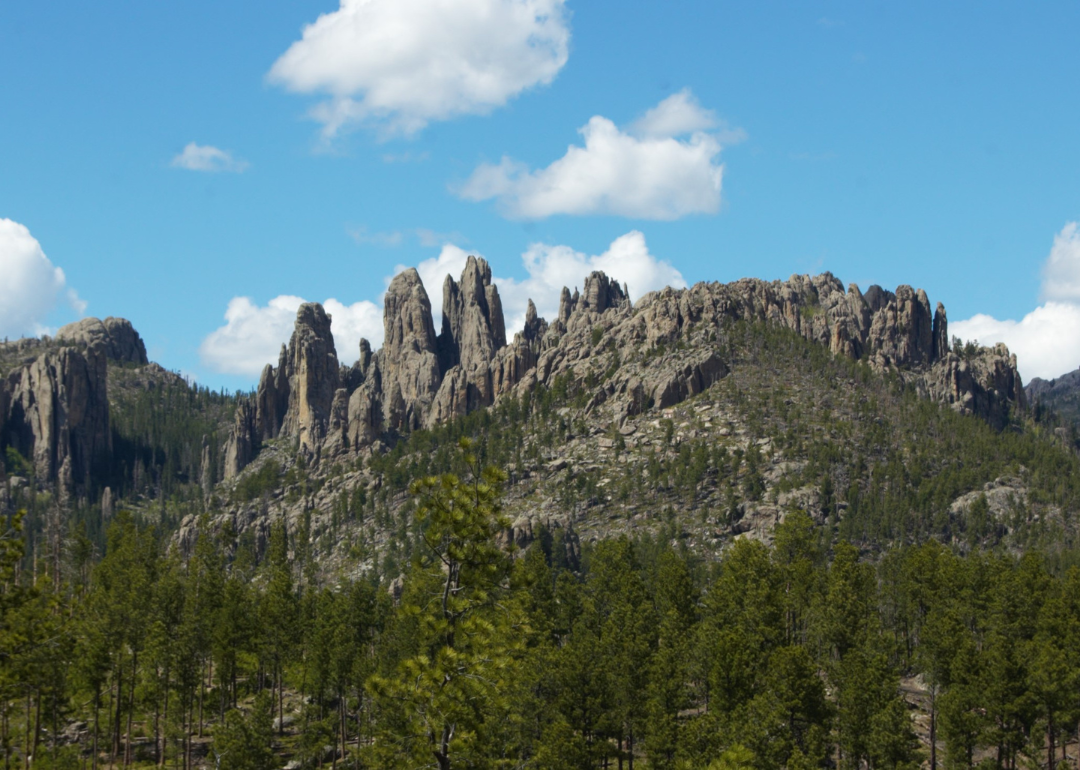
#50. Custer County
Canva
- Tornadoes since 2000: 9 (0.43 per 100 square miles)
- #1,993 nationally
- Tornadoes this year, as of May 31: 0
- #1,993 nationally
- Tornadoes this year, as of May 31: 0
#49. Oglala Lakota County

Canva
- Tornadoes since 2000: 10 (0.43 per 100 square miles)
- #1,991 nationally
- Tornadoes this year, as of May 31: 0
- #1,991 nationally
- Tornadoes this year, as of May 31: 0
#48. Dewey County

Canva
- Tornadoes since 2000: 8 (0.46 per 100 square miles)
- #1,987 nationally
- Tornadoes this year, as of May 31: 0
- #1,987 nationally
- Tornadoes this year, as of May 31: 0
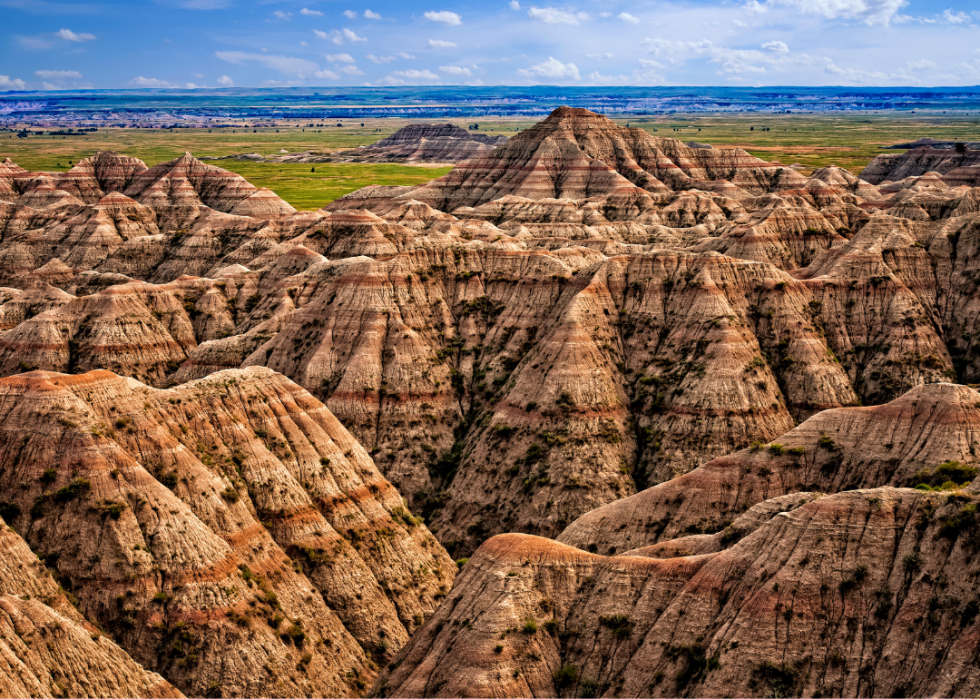
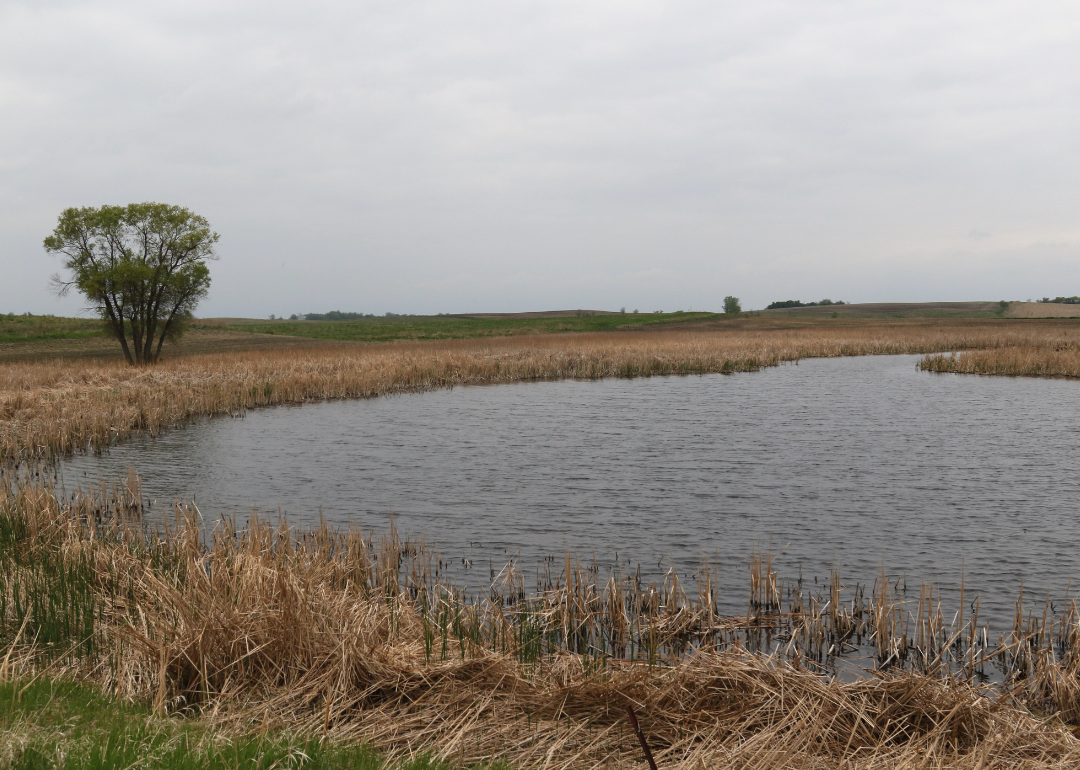
#47. Fall River County
Canva
- Tornadoes since 2000: 8 (0.49 per 100 square miles)
- #1,981 nationally
- Tornadoes this year, as of May 31: 0
- #1,981 nationally
- Tornadoes this year, as of May 31: 0
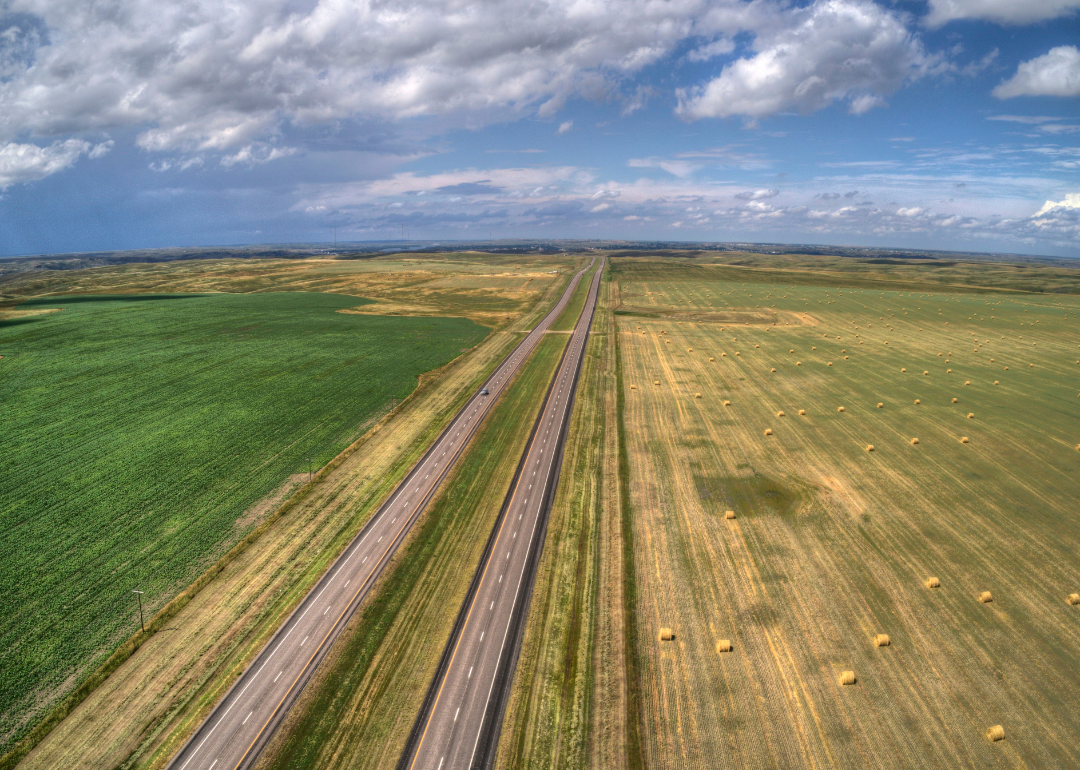
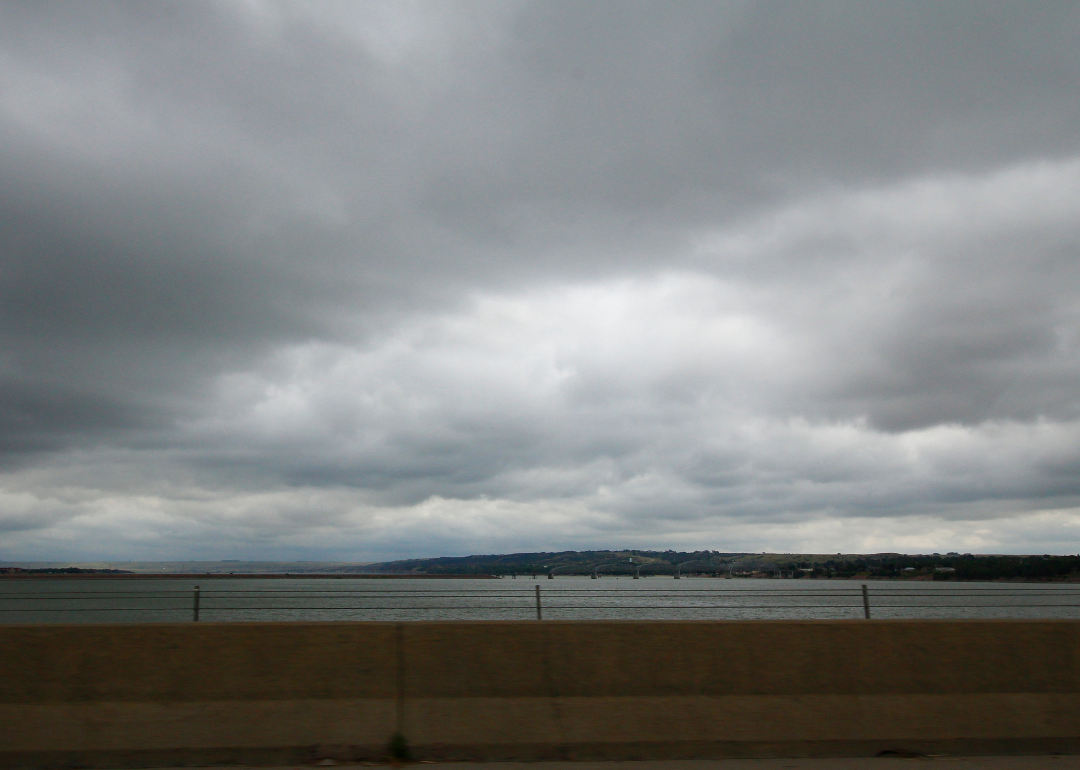
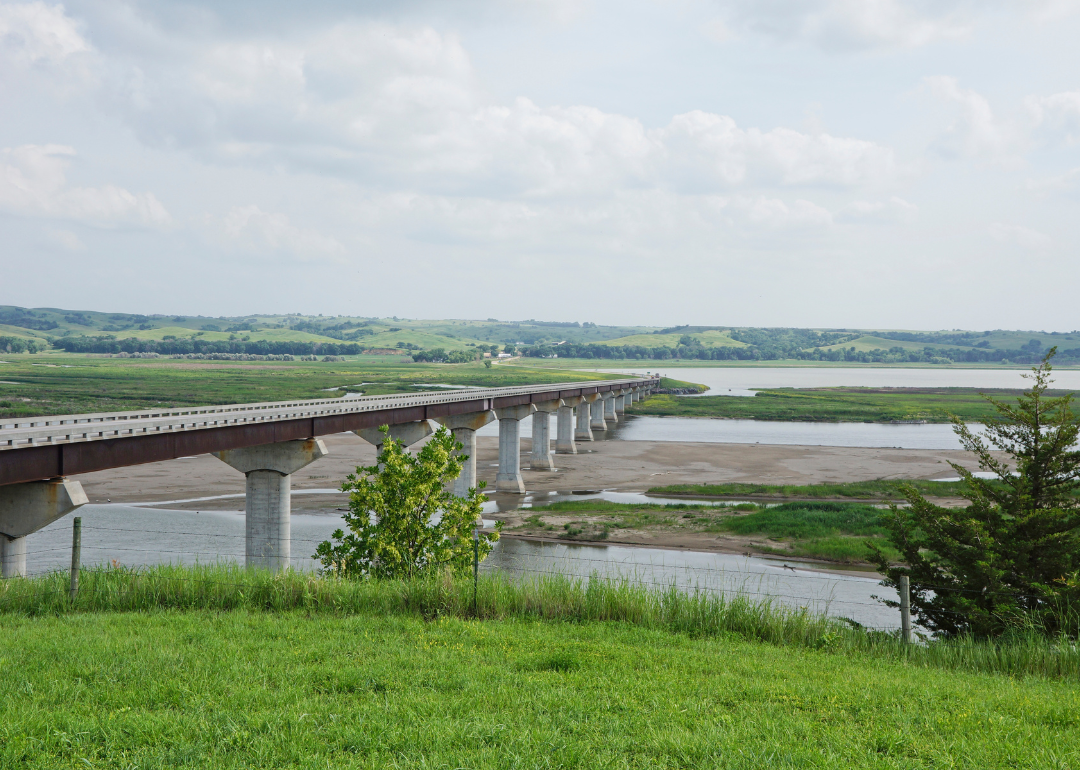
#46. Lyman County
thierry dehove // Shutterstock
- Tornadoes since 2000: 7 (0.50 per 100 square miles)
- #1,972 nationally
- Tornadoes this year, as of May 31: 0
- #1,972 nationally
- Tornadoes this year, as of May 31: 0
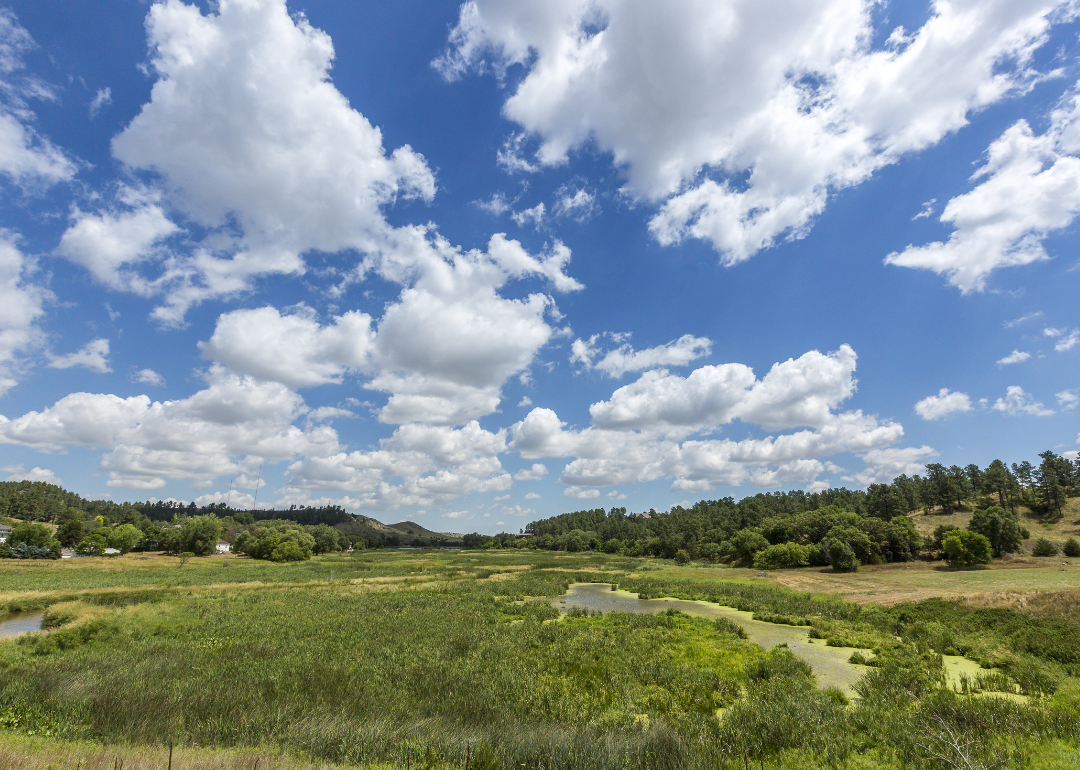
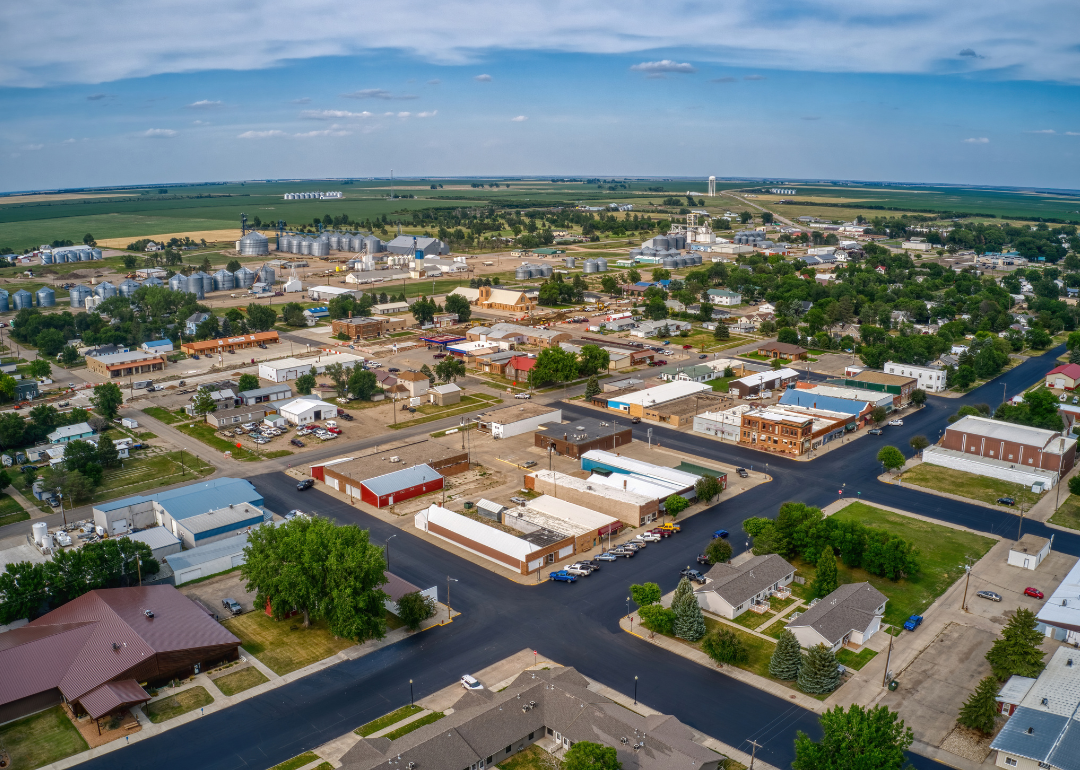
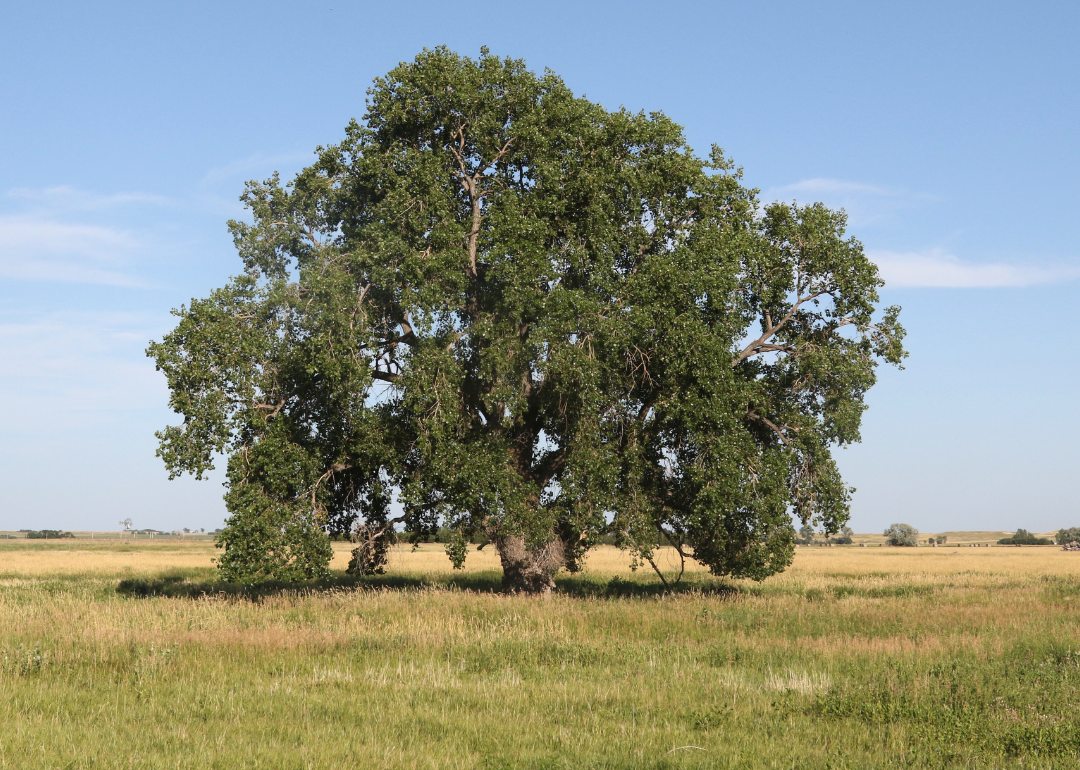
#45. Todd County
Jacob Boomsma // Shutterstock
- Tornadoes since 2000: 5 (0.58 per 100 square miles)
- #1,952 nationally
- Tornadoes this year, as of May 31: 0
- #1,952 nationally
- Tornadoes this year, as of May 31: 0
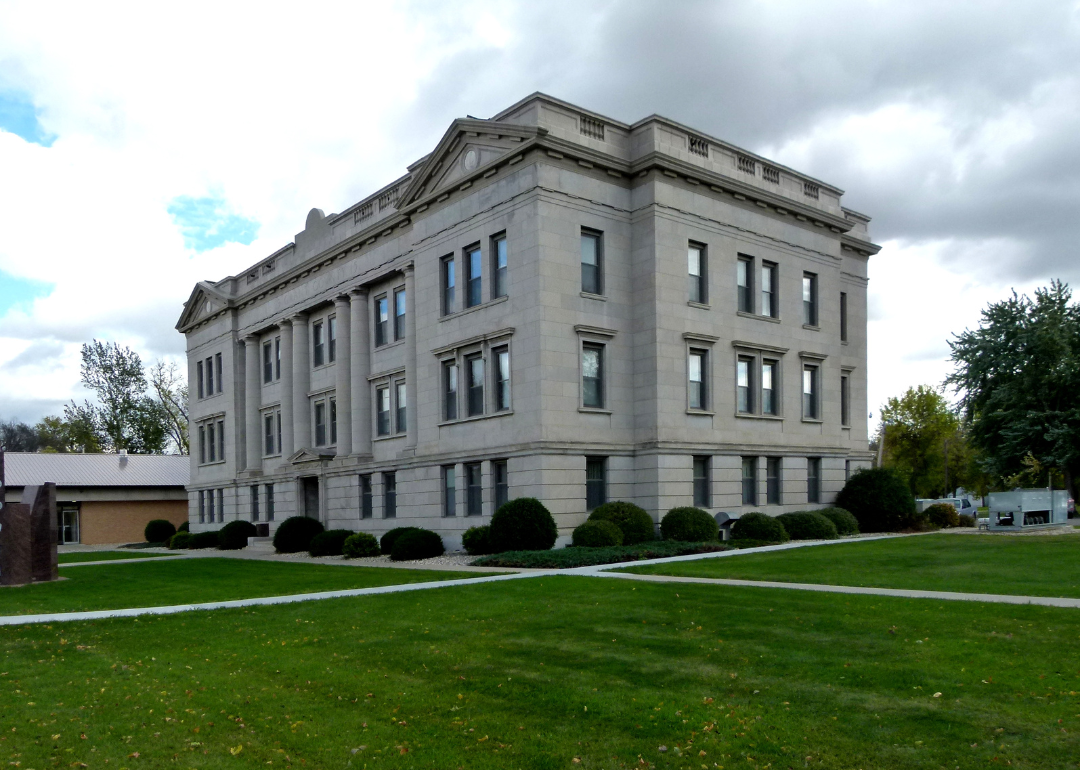
#44. Potter County
Canva
- Tornadoes since 2000: 5 (0.62 per 100 square miles)
- #1,936 nationally
- Tornadoes this year, as of May 31: 0
- #1,936 nationally
- Tornadoes this year, as of May 31: 0
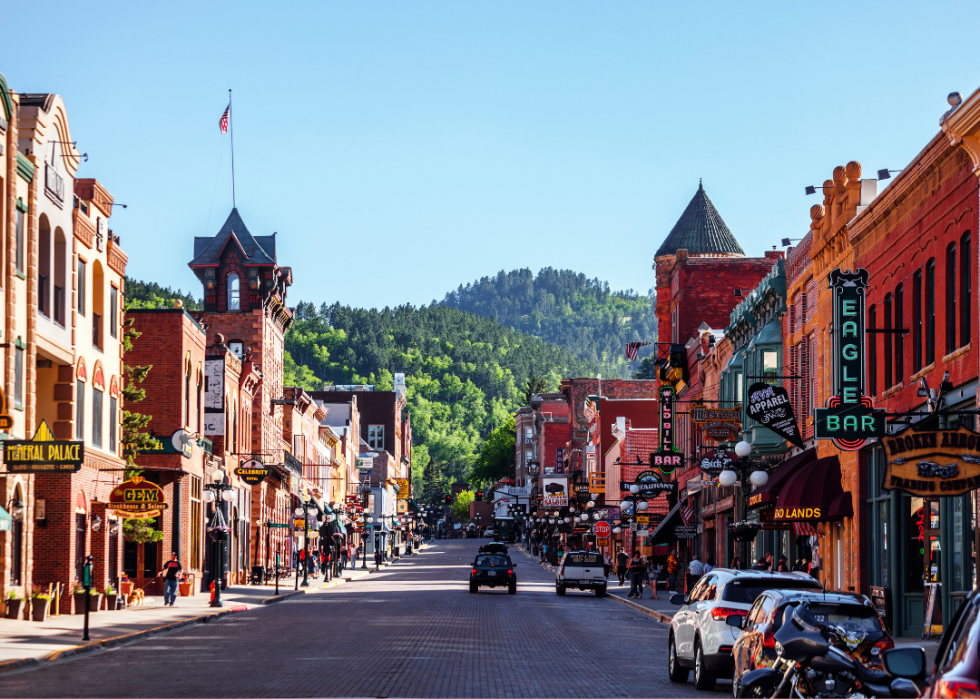
#43. Lawrence County
melissamn // Shutterstock
- Tornadoes since 2000: 5 (0.71 per 100 square miles)
- #1,915 nationally
- Tornadoes this year, as of May 31: 0
- #1,915 nationally
- Tornadoes this year, as of May 31: 0
#42. Aurora County
Jacob Boomsma // Shutterstock
- Tornadoes since 2000: 12 (0.74 per 100 square miles)
- #1,901 nationally
- Tornadoes this year, as of May 31: 0
- #1,901 nationally
- Tornadoes this year, as of May 31: 0
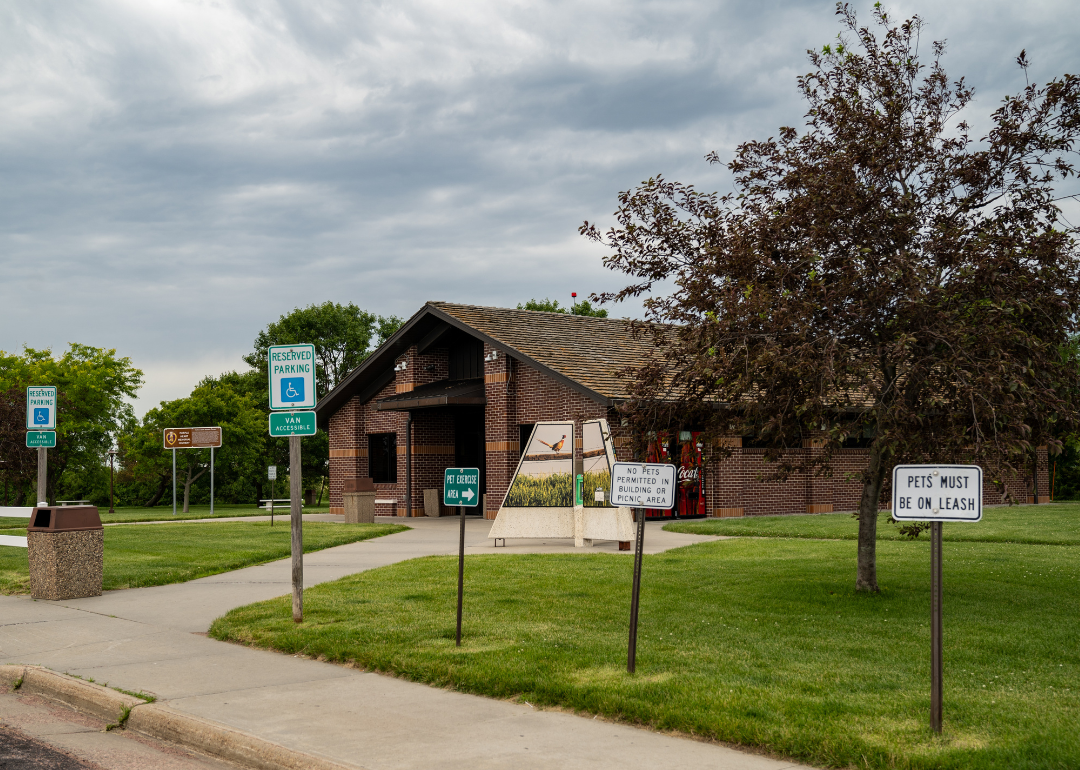
#41. Tripp County

davidrh // Shutterstock
- Tornadoes since 2000: 15 (0.76 per 100 square miles)
- #1,891 nationally
- Tornadoes this year, as of May 31: 0
- #1,891 nationally
- Tornadoes this year, as of May 31: 0
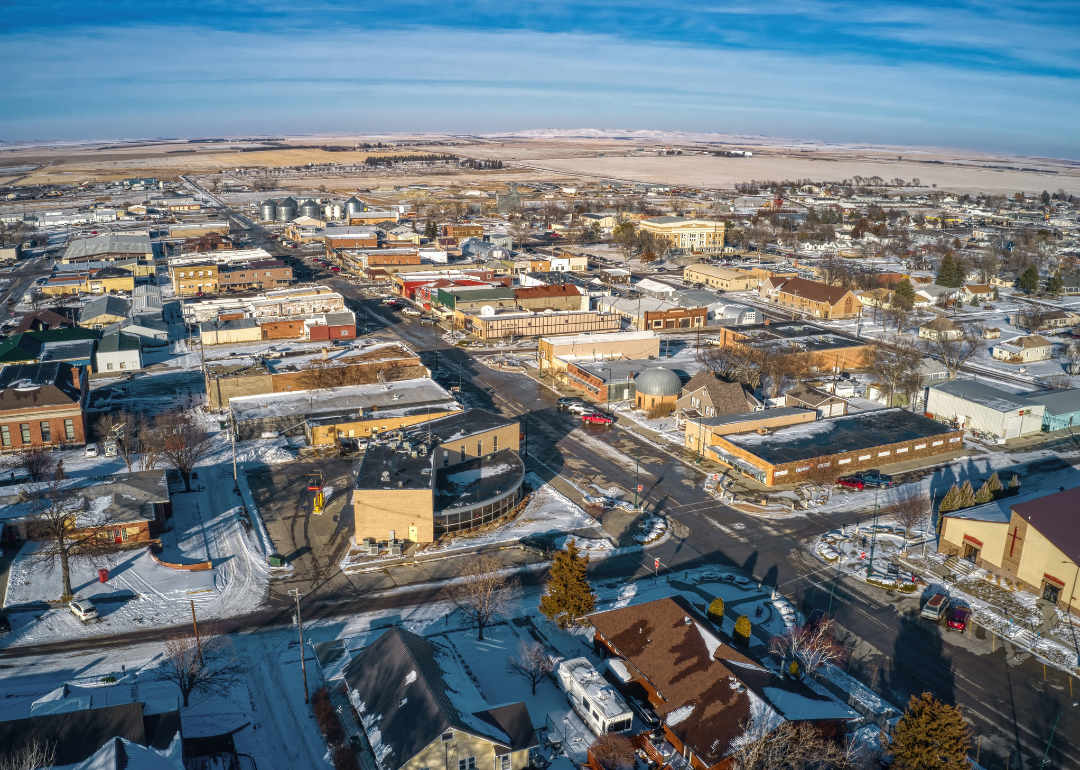
#40. Ziebach County
Jacob Boomsma // Shutterstock
- Tornadoes since 2000: 12 (0.80 per 100 square miles)
- #1,875 nationally
- Tornadoes this year, as of May 31: 0
- #1,875 nationally
- Tornadoes this year, as of May 31: 0
#39. Spink County
SevenMaps // Shutterstock
- Tornadoes since 2000: 8 (0.81 per 100 square miles)
- #1,869 nationally
- Tornadoes this year, as of May 31: 0
- #1,869 nationally
- Tornadoes this year, as of May 31: 0
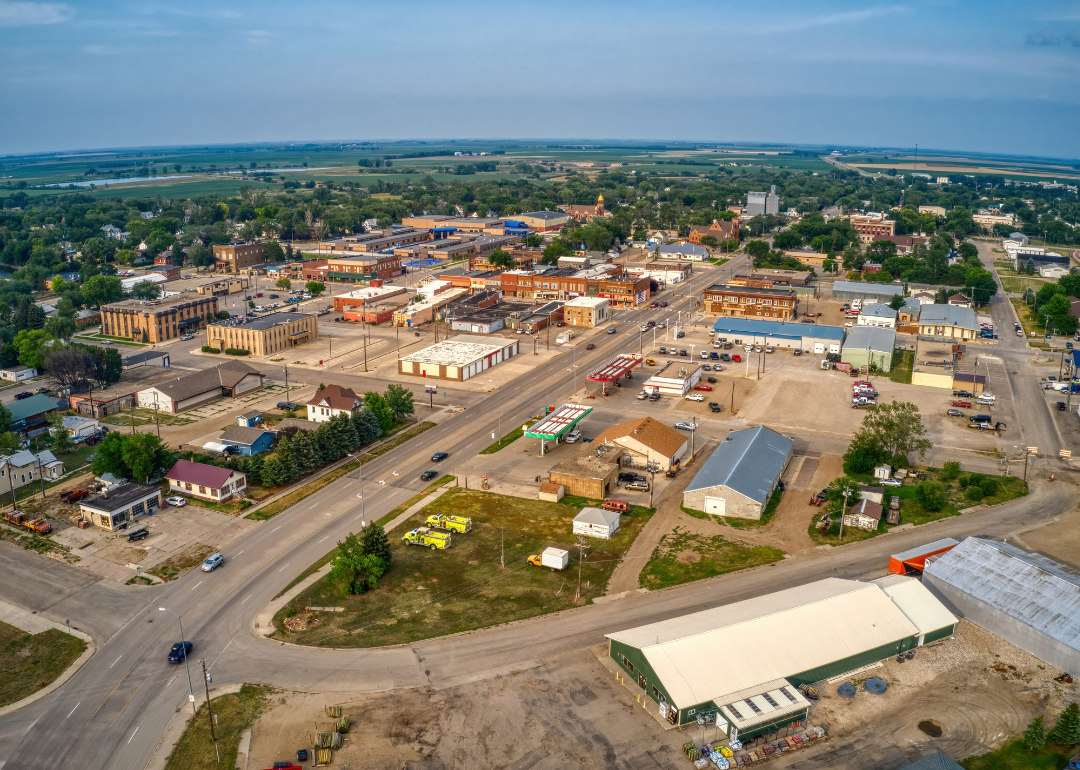
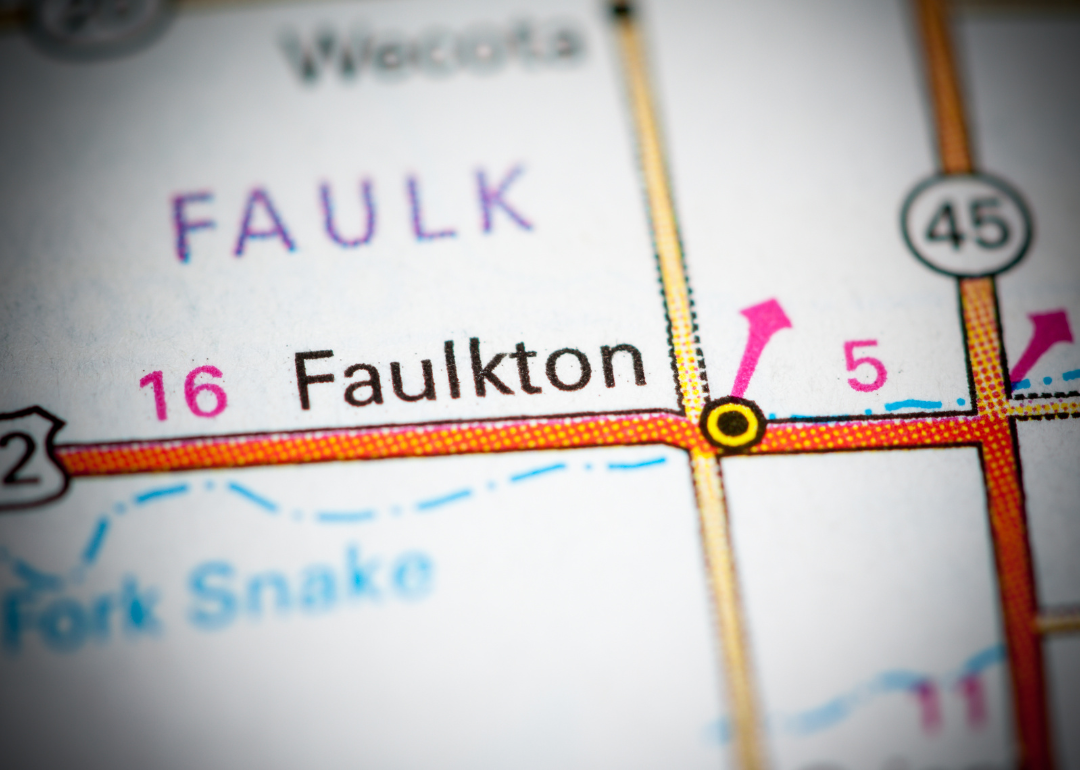
#38. Faulk County

Canva
- Tornadoes since 2000: 7 (0.88 per 100 square miles)
- #1,838 nationally
- Tornadoes this year, as of May 31: 0
- #1,838 nationally
- Tornadoes this year, as of May 31: 0
#37. Brookings County
SevenMaps // Shutterstock
- Tornadoes since 2000: 9 (0.89 per 100 square miles)
- #1,836 nationally
- Tornadoes this year, as of May 31: 0
- #1,836 nationally
- Tornadoes this year, as of May 31: 0
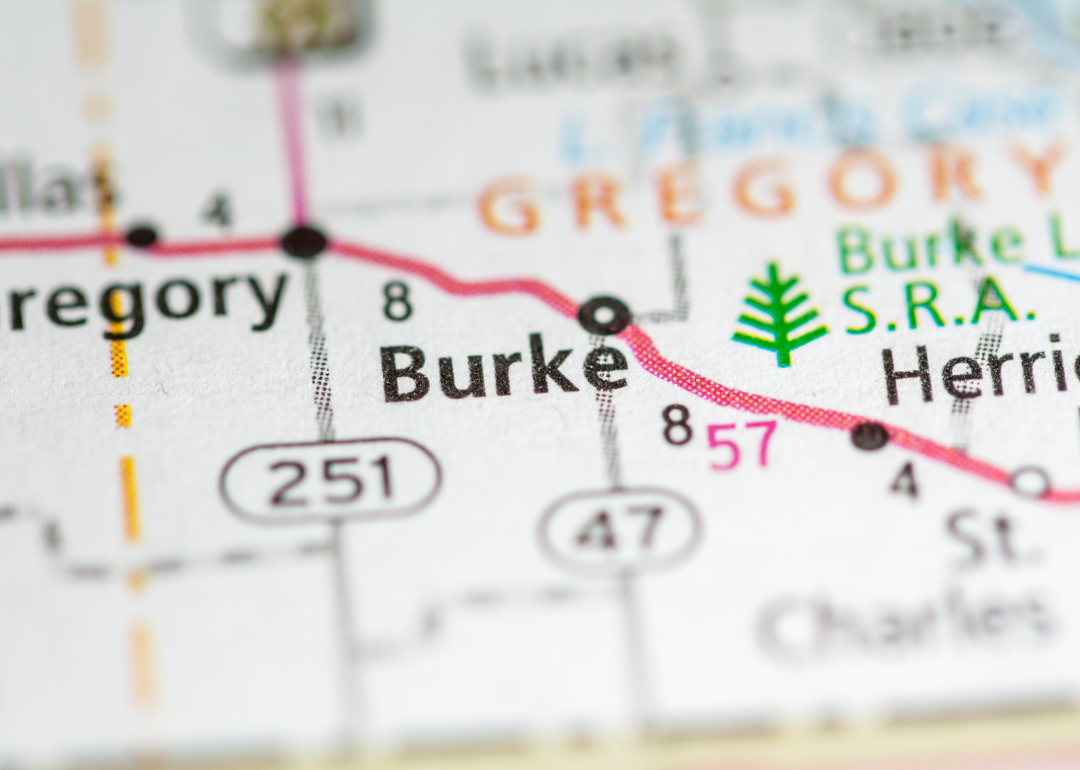
#36. Gregory County
Canva
- Tornadoes since 2000: 10 (0.91 per 100 square miles)
- #1,819 nationally
- Tornadoes this year, as of May 31: 0
- #1,819 nationally
- Tornadoes this year, as of May 31: 0
#35. Charles Mix County
Canva
- Tornadoes since 2000: 8 (0.98 per 100 square miles)
- #1,788 nationally
- Tornadoes this year, as of May 31: 0
- #1,788 nationally
- Tornadoes this year, as of May 31: 0
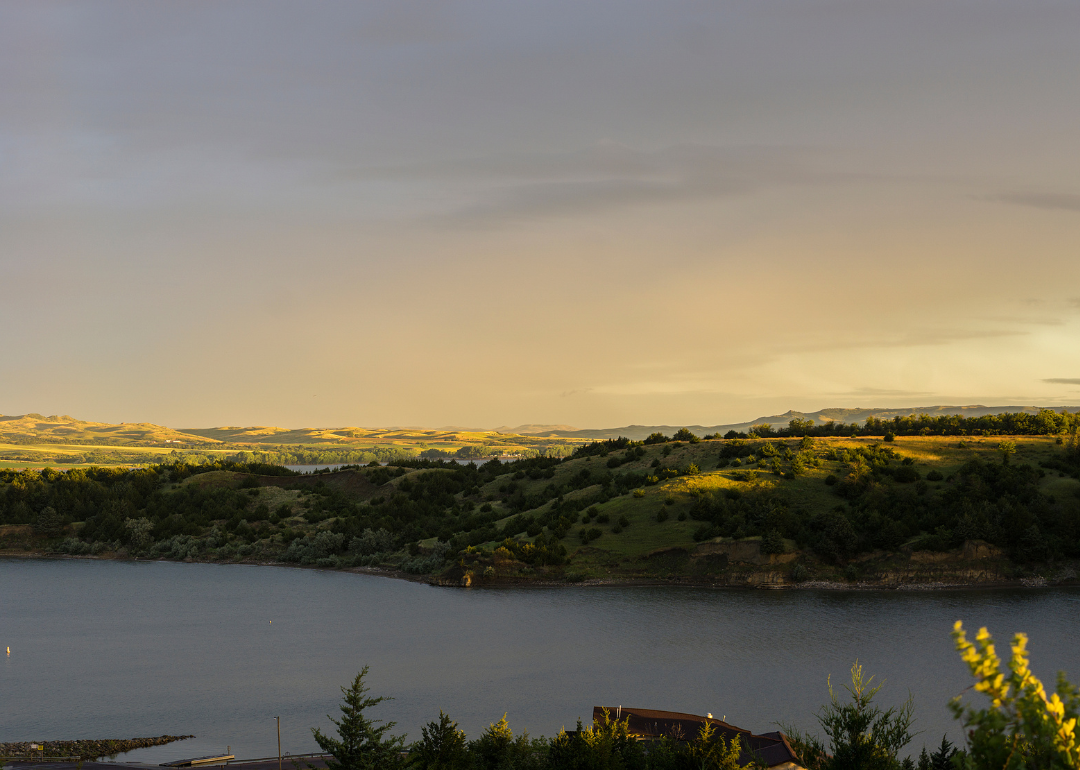
#34. Brule County

Canva
- Tornadoes since 2000: 11 (1.00 per 100 square miles)
- #1,775 nationally
- Tornadoes this year, as of May 31: 0
- #1,775 nationally
- Tornadoes this year, as of May 31: 0
#33. Roberts County
vagabond54 // Shutterstock
- Tornadoes since 2000: 12 (1.01 per 100 square miles)
- #1,769 nationally
- Tornadoes this year, as of May 31: 0
- #1,769 nationally
- Tornadoes this year, as of May 31: 0
#32. Bennett County

Canva
- Tornadoes since 2000: 7 (1.02 per 100 square miles)
- #1,768 nationally
- Tornadoes this year, as of May 31: 0
- #1,768 nationally
- Tornadoes this year, as of May 31: 0
#31. Codington County
Canva
- Tornadoes since 2000: 7 (1.03 per 100 square miles)
- #1,764 nationally
- Tornadoes this year, as of May 31: 1
- #1,764 nationally
- Tornadoes this year, as of May 31: 1
#30. Grant County

SevenMaps // Shutterstock
- Tornadoes since 2000: 9 (1.05 per 100 square miles)
- #1,758 nationally
- Tornadoes this year, as of May 31: 0
- #1,758 nationally
- Tornadoes this year, as of May 31: 0
#29. Hyde County

SevenMaps // Shutterstock
- Tornadoes since 2000: 12 (1.06 per 100 square miles)
- #1,749 nationally
- Tornadoes this year, as of May 31: 0
- #1,749 nationally
- Tornadoes this year, as of May 31: 0
#28. McPherson County
vagabond54 // Shutterstock
- Tornadoes since 2000: 11 (1.07 per 100 square miles)
- #1,738 nationally
- Tornadoes this year, as of May 31: 0
- #1,738 nationally
- Tornadoes this year, as of May 31: 0
#27. Day County

SevenMaps // Shutterstock
- Tornadoes since 2000: 13 (1.15 per 100 square miles)
- #1,676 nationally
- Tornadoes this year, as of May 31: 0
- #1,676 nationally
- Tornadoes this year, as of May 31: 0
#26. Edmunds County
SevenMaps // Shutterstock
- Tornadoes since 2000: 10 (1.19 per 100 square miles)
- #1,650 nationally
- Tornadoes this year, as of May 31: 0
- #1,650 nationally
- Tornadoes this year, as of May 31: 0
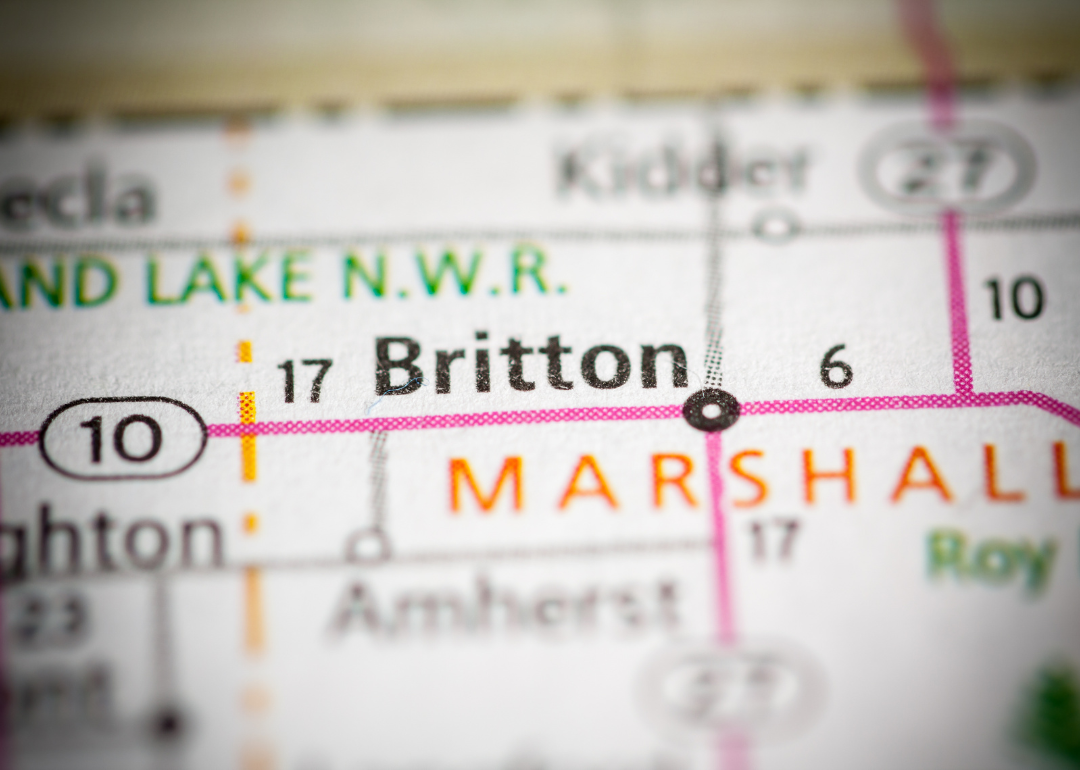
#25. Marshall County
Bennekom // Shutterstock
- Tornadoes since 2000: 7 (1.24 per 100 square miles)
- #1,600 nationally
- Tornadoes this year, as of May 31: 0
- #1,600 nationally
- Tornadoes this year, as of May 31: 0
#24. Bon Homme County
Canva
- Tornadoes since 2000: 16 (1.27 per 100 square miles)
- #1,568 nationally
- Tornadoes this year, as of May 31: 0
- #1,568 nationally
- Tornadoes this year, as of May 31: 0
#23. Beadle County
Jacob Boomsma // Shutterstock
- Tornadoes since 2000: 7 (1.33 per 100 square miles)
- #1,535 nationally
- Tornadoes this year, as of May 31: 0
- #1,535 nationally
- Tornadoes this year, as of May 31: 0
#22. Jerauld County
Jacob Boomsma // Shutterstock
- Tornadoes since 2000: 23 (1.34 per 100 square miles)
- #1,521 nationally
- Tornadoes this year, as of May 31: 0
- #1,521 nationally
- Tornadoes this year, as of May 31: 0
#21. Brown County
Jacob Boomsma // Shutterstock
- Tornadoes since 2000: 7 (1.38 per 100 square miles)
- #1,496 nationally
- Tornadoes this year, as of May 31: 0
- #1,496 nationally
- Tornadoes this year, as of May 31: 0
#20. Hamlin County

SevenMaps // Shutterstock
- Tornadoes since 2000: 20 (1.39 per 100 square miles)
- #1,488 nationally
- Tornadoes this year, as of May 31: 0
- #1,488 nationally
- Tornadoes this year, as of May 31: 0
#19. Hand County

Canva
- Tornadoes since 2000: 8 (1.42 per 100 square miles)
- #1,466 nationally
- Tornadoes this year, as of May 31: 0
- #1,466 nationally
- Tornadoes this year, as of May 31: 0
#18. Lake County
Jacob Boomsma // Shutterstock
- Tornadoes since 2000: 14 (1.46 per 100 square miles)
- #1,442 nationally
- Tornadoes this year, as of May 31: 0
- #1,442 nationally
- Tornadoes this year, as of May 31: 0
#17. Clark County
Canva
- Tornadoes since 2000: 8 (1.54 per 100 square miles)
- #1,397 nationally
- Tornadoes this year, as of May 31: 0
- #1,397 nationally
- Tornadoes this year, as of May 31: 0
#16. Yankton County
Canva
- Tornadoes since 2000: 11 (1.55 per 100 square miles)
- #1,392 nationally
- Tornadoes this year, as of May 31: 0
- #1,392 nationally
- Tornadoes this year, as of May 31: 0
#15. Walworth County
Canva
- Tornadoes since 2000: 9 (1.58 per 100 square miles)
- #1,368 nationally
- Tornadoes this year, as of May 31: 0
- #1,368 nationally
- Tornadoes this year, as of May 31: 0
#14. Sanborn County

Danita Delimont // Shutterstock
- Tornadoes since 2000: 13 (1.60 per 100 square miles)
- #1,355 nationally
- Tornadoes this year, as of May 31: 0
- #1,355 nationally
- Tornadoes this year, as of May 31: 0
#13. Hutchinson County

SevenMaps // Shutterstock
- Tornadoes since 2000: 7 (1.62 per 100 square miles)
- #1,336 nationally
- Tornadoes this year, as of May 31: 0
- #1,336 nationally
- Tornadoes this year, as of May 31: 0
#12. Douglas County

Sabrina Janelle Gordon // Shutterstock
- Tornadoes since 2000: 8 (1.74 per 100 square miles)
- #1,255 nationally
- Tornadoes this year, as of May 31: 0
- #1,255 nationally
- Tornadoes this year, as of May 31: 0
#11. Union County

Patrick Ziegler // Shutterstock
- Tornadoes since 2000: 10 (1.74 per 100 square miles)
- #1,251 nationally
- Tornadoes this year, as of May 31: 0
- #1,251 nationally
- Tornadoes this year, as of May 31: 0
#10. McCook County

J K Laws // Shutterstock
- Tornadoes since 2000: 8 (1.84 per 100 square miles)
- #1,176 nationally
- Tornadoes this year, as of May 31: 0
- #1,176 nationally
- Tornadoes this year, as of May 31: 0
#9. Davison County

SevenMaps // Shutterstock
- Tornadoes since 2000: 8 (1.84 per 100 square miles)
- #1,170 nationally
- Tornadoes this year, as of May 31: 0
- #1,170 nationally
- Tornadoes this year, as of May 31: 0
#8. Hanson County
Steven Frame // Shutterstock
- Tornadoes since 2000: 19 (2.35 per 100 square miles)
- #823 nationally
- Tornadoes this year, as of May 31: 0
- #823 nationally
- Tornadoes this year, as of May 31: 0
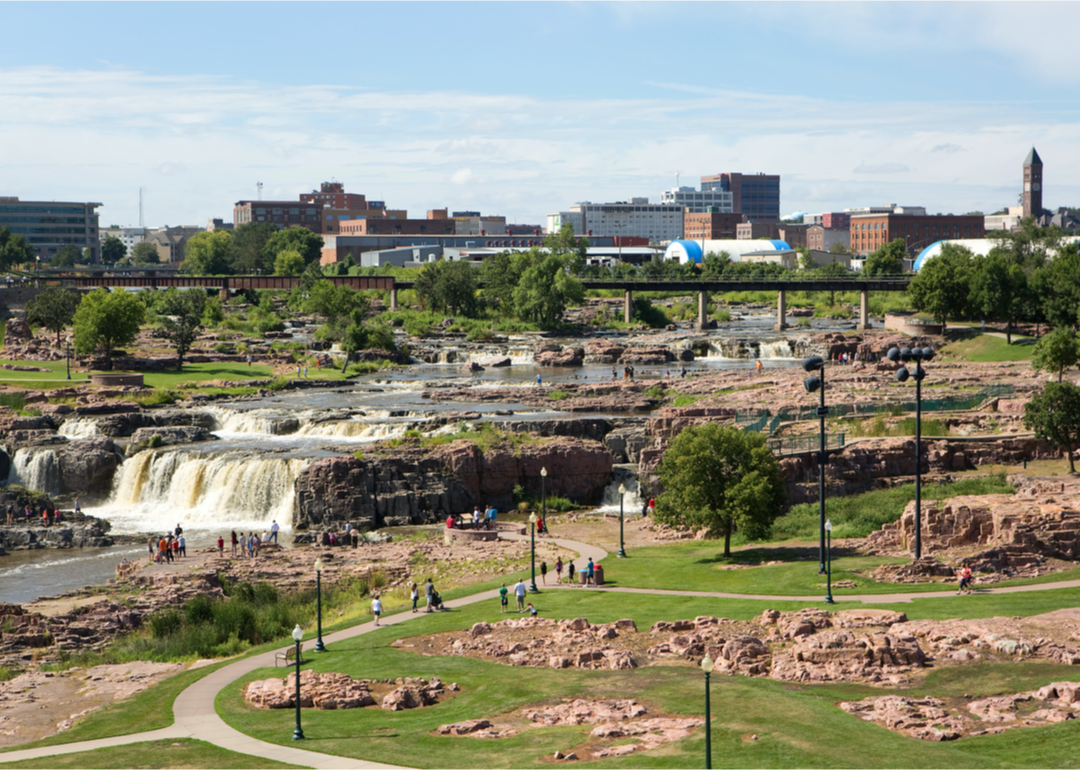
#7. Minnehaha County
SevenMaps // Shutterstock
- Tornadoes since 2000: 15 (2.41 per 100 square miles)
- #782 nationally
- Tornadoes this year, as of May 31: 1
- #782 nationally
- Tornadoes this year, as of May 31: 1
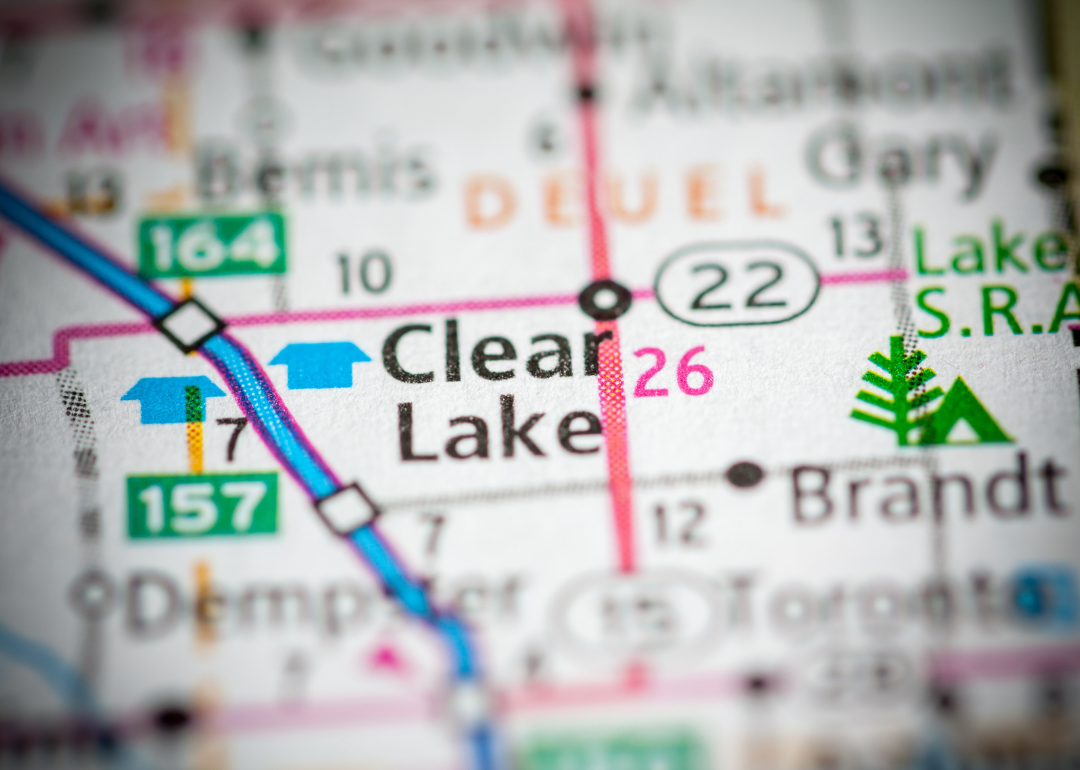
#6. Deuel County
Canva
- Tornadoes since 2000: 15 (2.63 per 100 square miles)
- #661 nationally
- Tornadoes this year, as of May 31: 0
- #661 nationally
- Tornadoes this year, as of May 31: 0
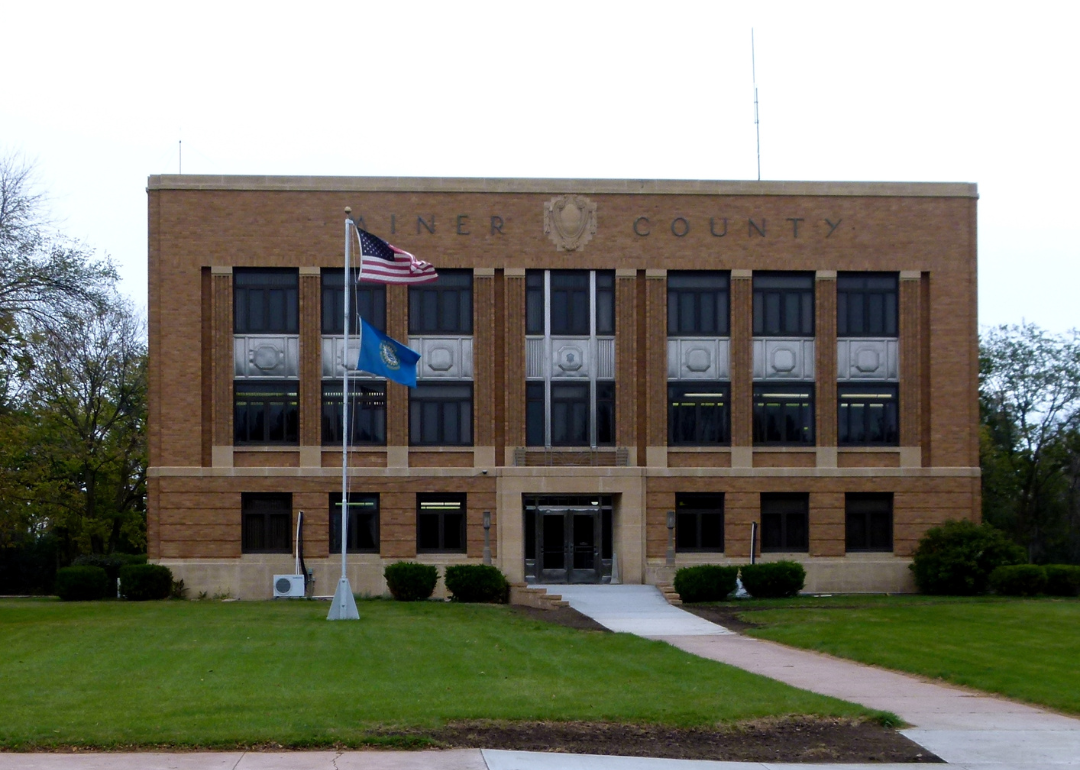
#5. Miner County
Canva
- Tornadoes since 2000: 24 (2.88 per 100 square miles)
- #556 nationally
- Tornadoes this year, as of May 31: 0
- #556 nationally
- Tornadoes this year, as of May 31: 0
#4. Kingsbury County

Canva
- Tornadoes since 2000: 13 (3.15 per 100 square miles)
- #436 nationally
- Tornadoes this year, as of May 31: 0
- #436 nationally
- Tornadoes this year, as of May 31: 0
#3. Clay County

Jacob Boomsma // Shutterstock
- Tornadoes since 2000: 22 (3.57 per 100 square miles)
- #308 nationally
- Tornadoes this year, as of May 31: 0
- #308 nationally
- Tornadoes this year, as of May 31: 0
#2. Turner County

Canva
- Tornadoes since 2000: 34 (5.89 per 100 square miles)
- #55 nationally
- Tornadoes this year, as of May 31: 0
- #55 nationally
- Tornadoes this year, as of May 31: 0
#1. Lincoln County
Canva