Counties with the most bridges in dire need of repair in Washington
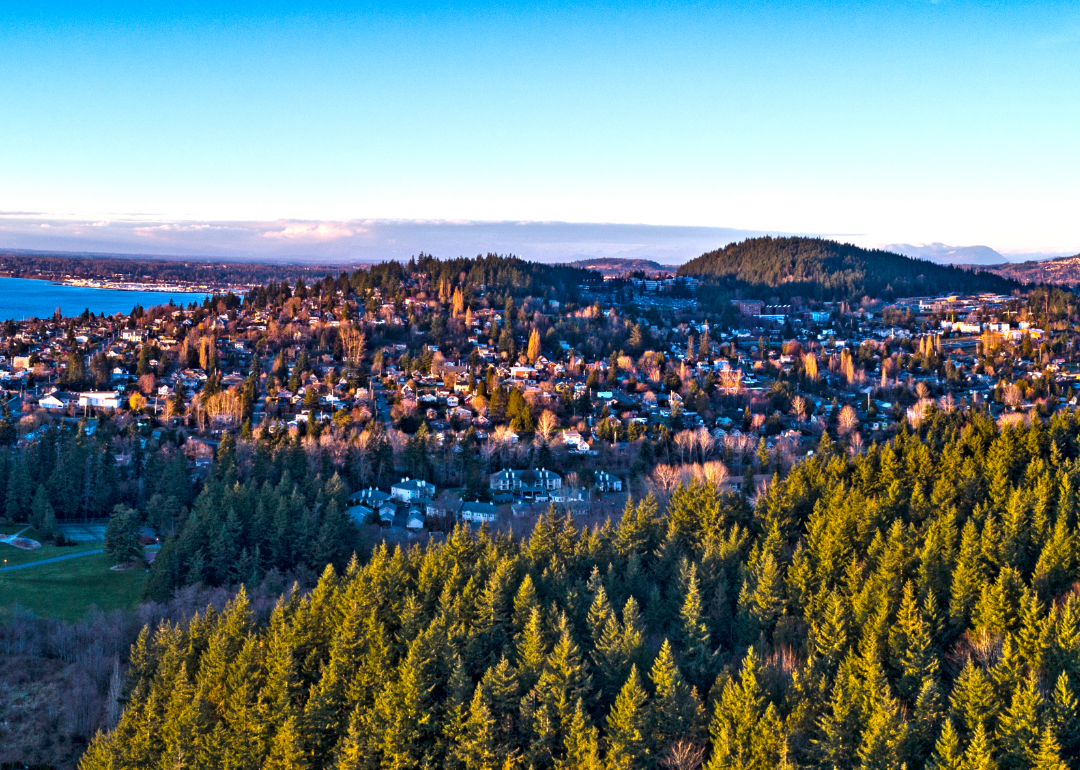
- Bridges in poor condition: 5.2% (18 of 348 bridges)
- Square meters of bridges in poor condition: 3.1% (4,565 of 146,740 square meters of bridges)
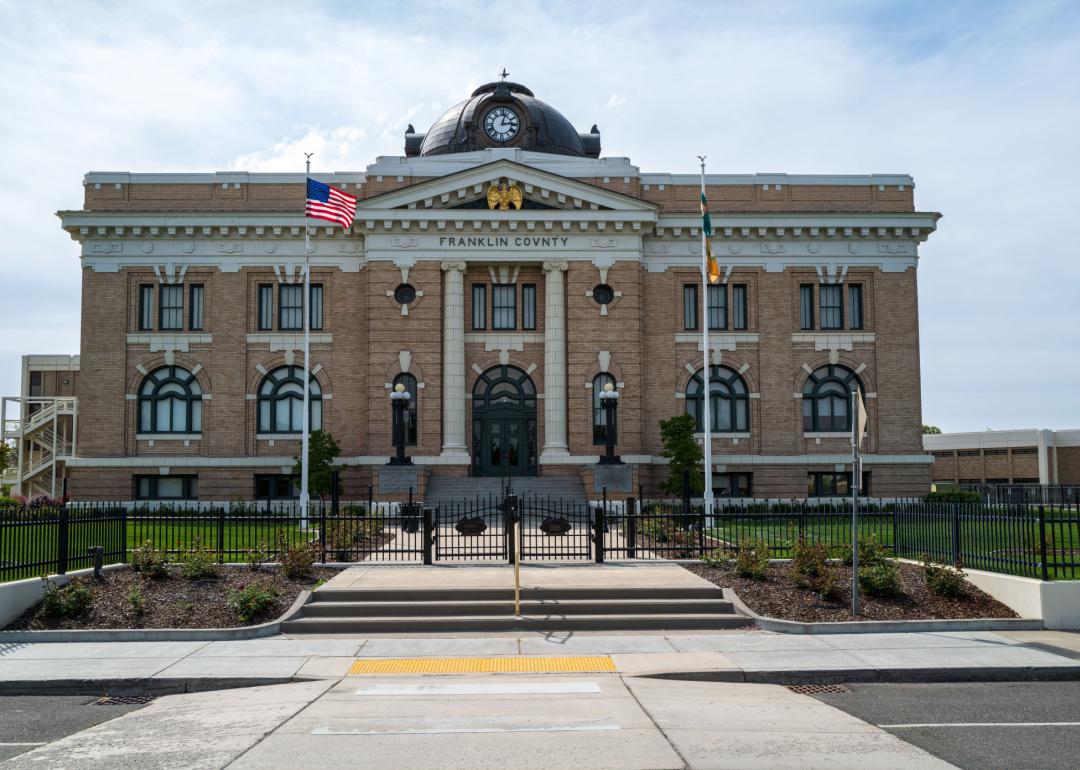
- Bridges in poor condition: 5.2% (7 of 134 bridges)
- Square meters of bridges in poor condition: 2.8% (1,710 of 61,055 square meters of bridges)
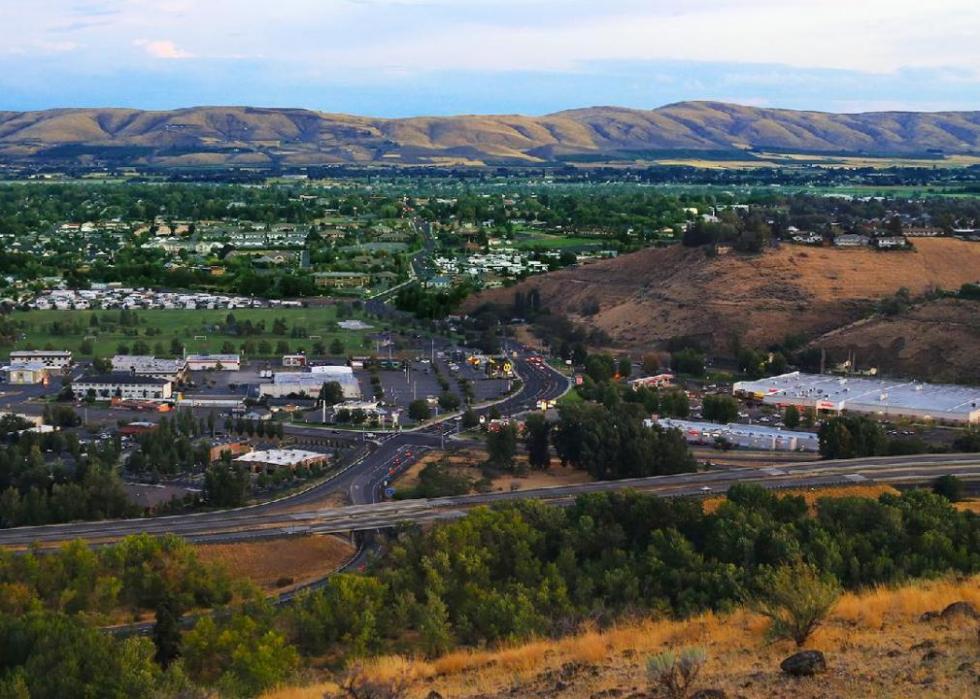
- Bridges in poor condition: 5.3% (29 of 551 bridges)
- Square meters of bridges in poor condition: 13.1% (32,694 of 249,546 square meters of bridges)
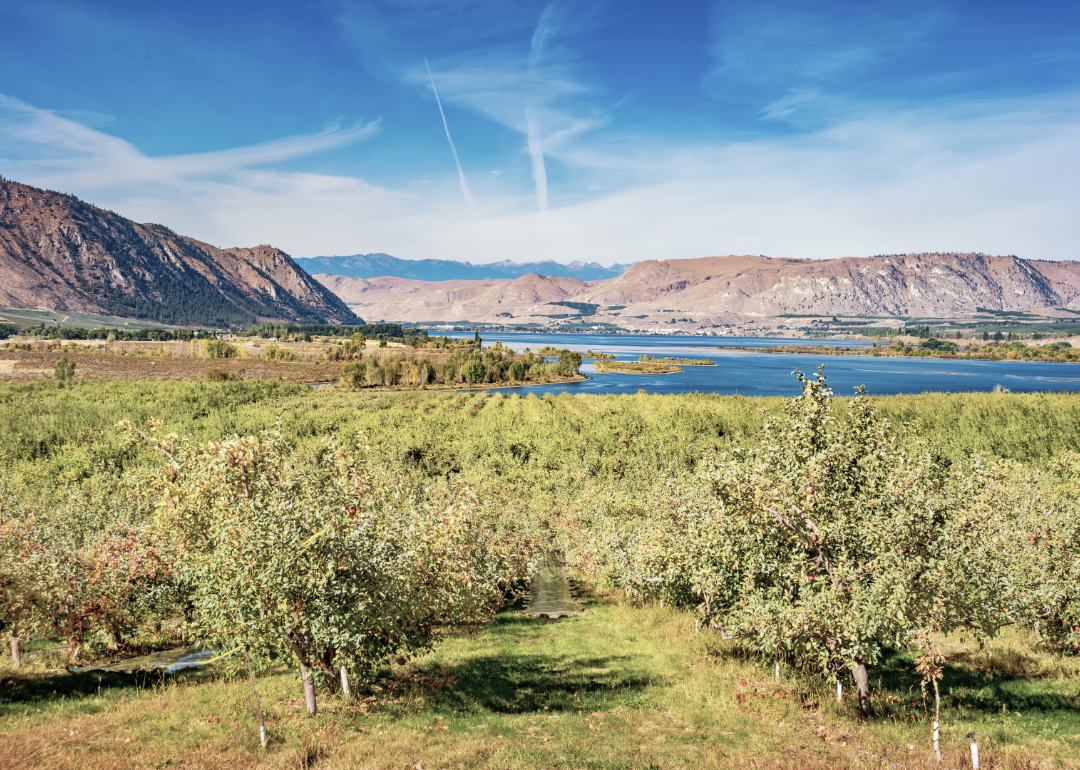
- Bridges in poor condition: 5.8% (9 of 154 bridges)
- Square meters of bridges in poor condition: 12.2% (6,541 of 53,572 square meters of bridges)

- Bridges in poor condition: 6.2% (9 of 146 bridges)
- Square meters of bridges in poor condition: 5.4% (3,927 of 72,718 square meters of bridges)
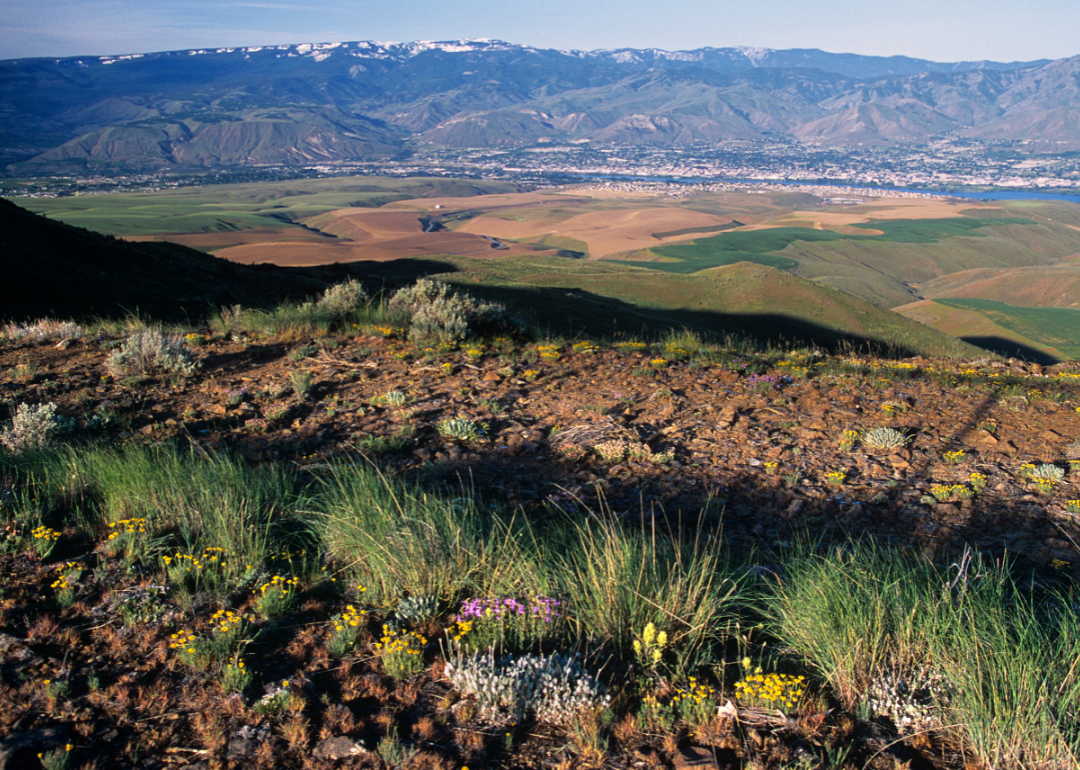
- Bridges in poor condition: 6.3% (9 of 142 bridges)
- Square meters of bridges in poor condition: 23.5% (17,098 of 72,688 square meters of bridges)
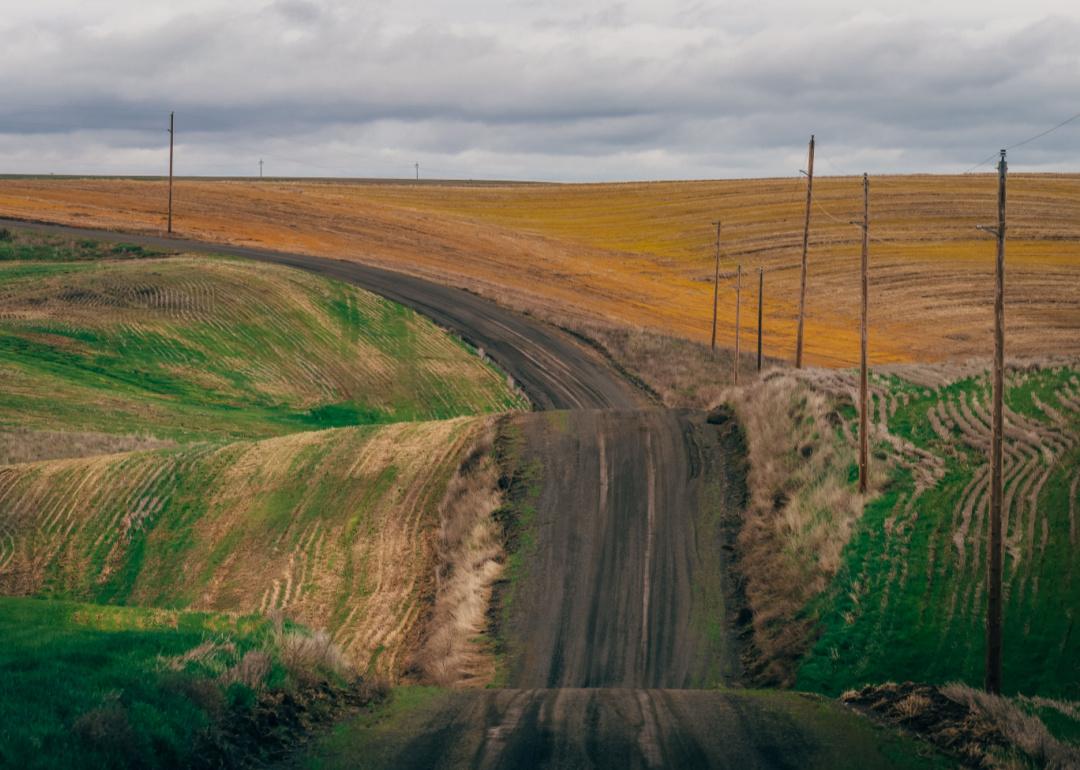
- Bridges in poor condition: 6.4% (12 of 188 bridges)
- Square meters of bridges in poor condition: 13.2% (7,417 of 56,276 square meters of bridges)
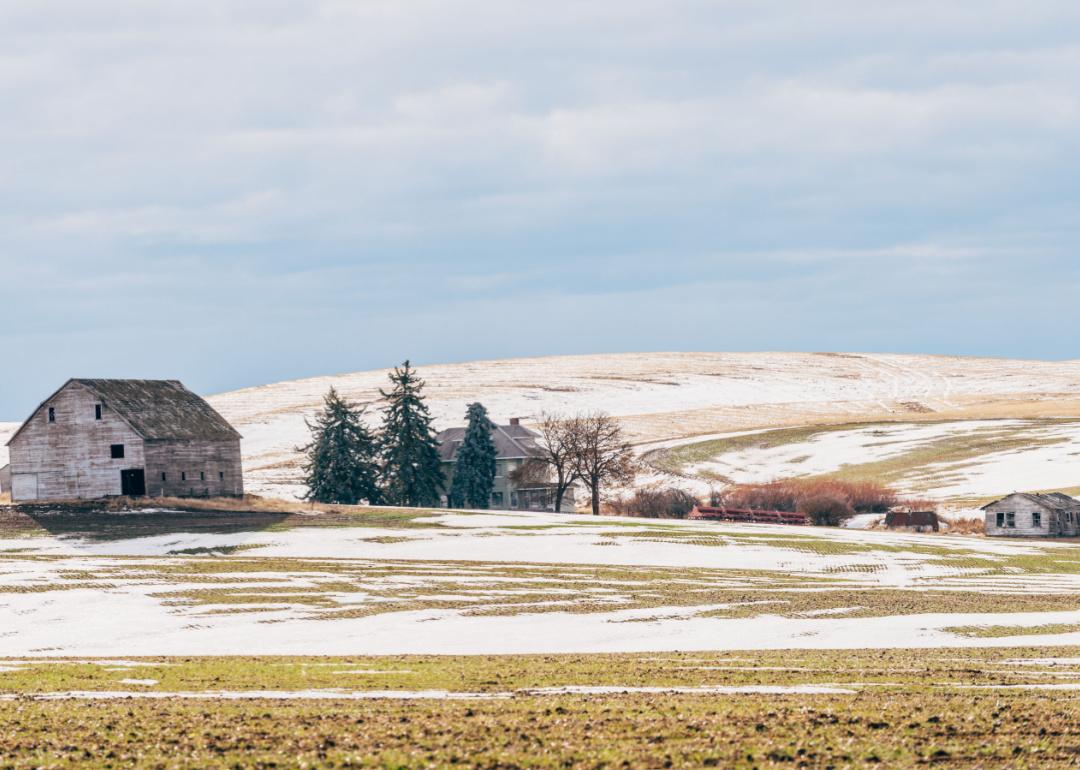
- Bridges in poor condition: 7.3% (13 of 179 bridges)
- Square meters of bridges in poor condition: 4.8% (1,768 of 36,690 square meters of bridges)
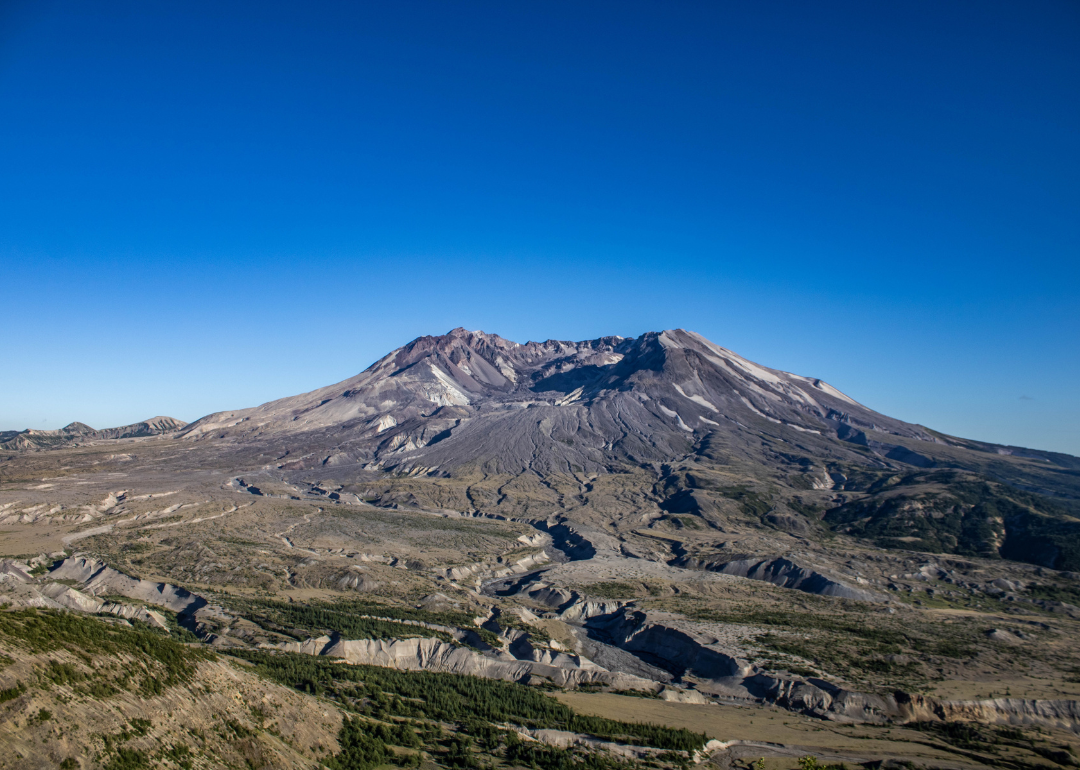
- Bridges in poor condition: 7.5% (9 of 120 bridges)
- Square meters of bridges in poor condition: 5.4% (2,280 of 42,226 square meters of bridges)
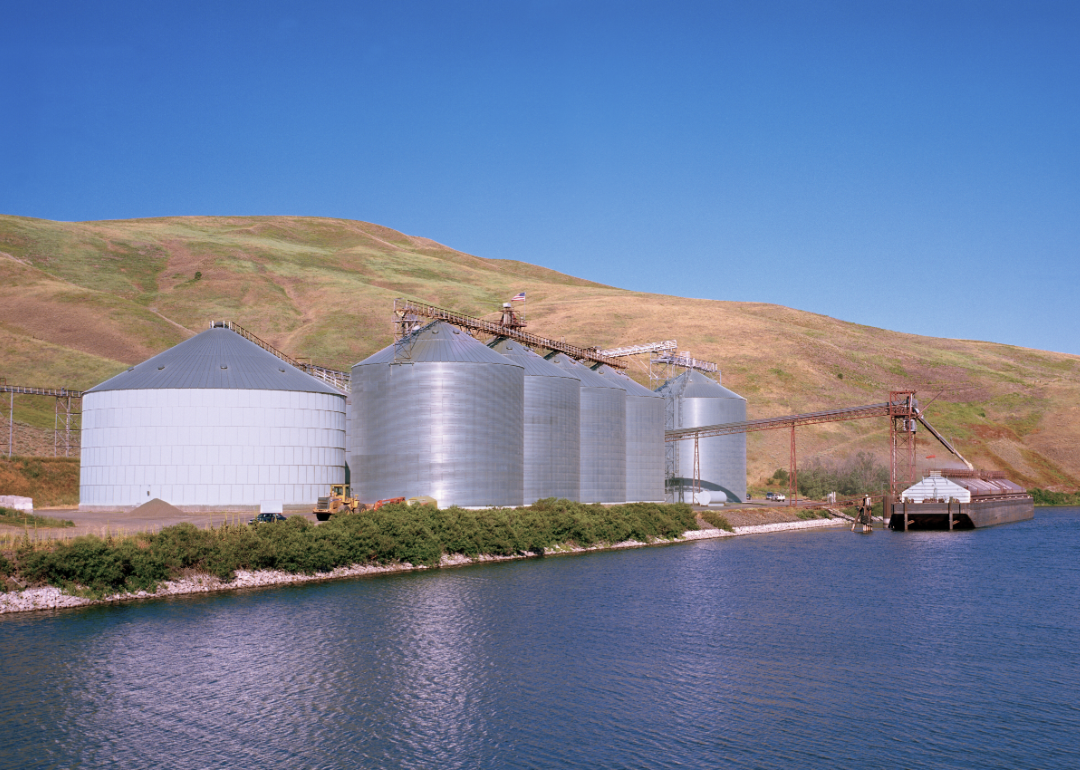
- Bridges in poor condition: 7.5% (4 of 53 bridges)
- Square meters of bridges in poor condition: 37.3% (6,099 of 16,340 square meters of bridges)
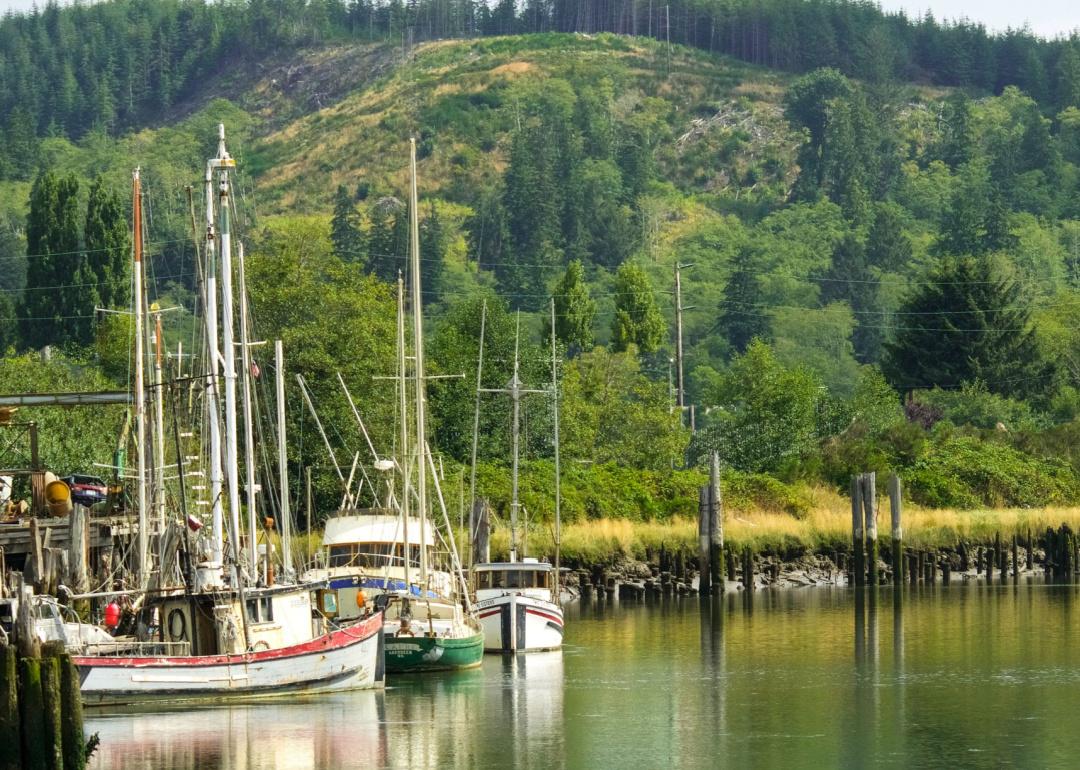
- Bridges in poor condition: 8.1% (29 of 358 bridges)
- Square meters of bridges in poor condition: 16.3% (31,427 of 192,336 square meters of bridges)
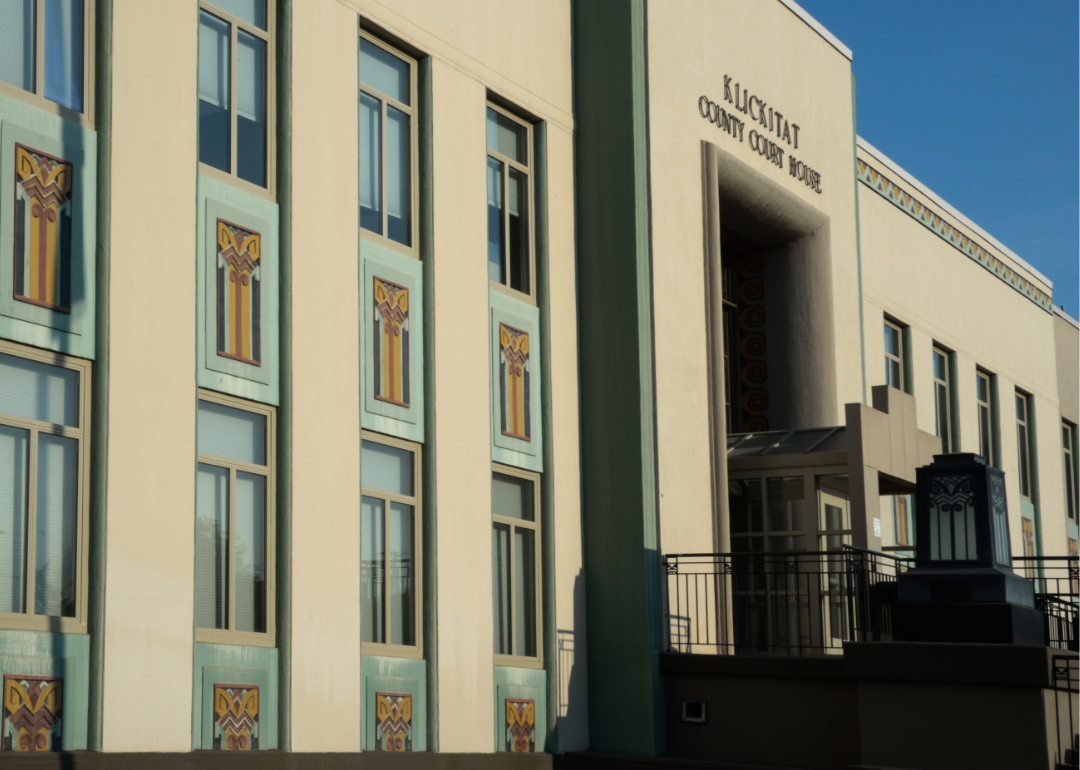
- Bridges in poor condition: 8.2% (8 of 97 bridges)
- Square meters of bridges in poor condition: 23.8% (12,440 of 52,233 square meters of bridges)

- Bridges in poor condition: 8.5% (26 of 305 bridges)
- Square meters of bridges in poor condition: 13.0% (43,362 of 334,199 square meters of bridges)

- Bridges in poor condition: 9.3% (8 of 86 bridges)
- Square meters of bridges in poor condition: 11.5% (2,510 of 21,823 square meters of bridges)
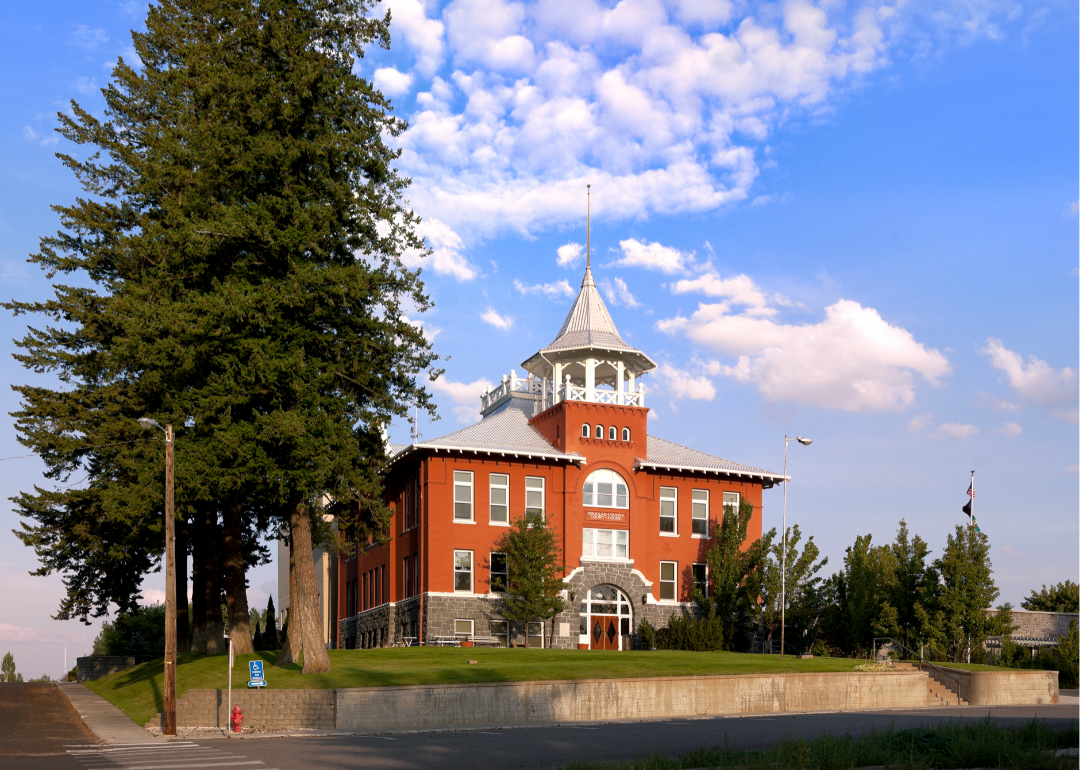
- Bridges in poor condition: 10.0% (4 of 40 bridges)
- Square meters of bridges in poor condition: 10.5% (3,919 of 37,455 square meters of bridges)

- Bridges in poor condition: 10.4% (19 of 182 bridges)
- Square meters of bridges in poor condition: 8.2% (6,108 of 74,908 square meters of bridges)
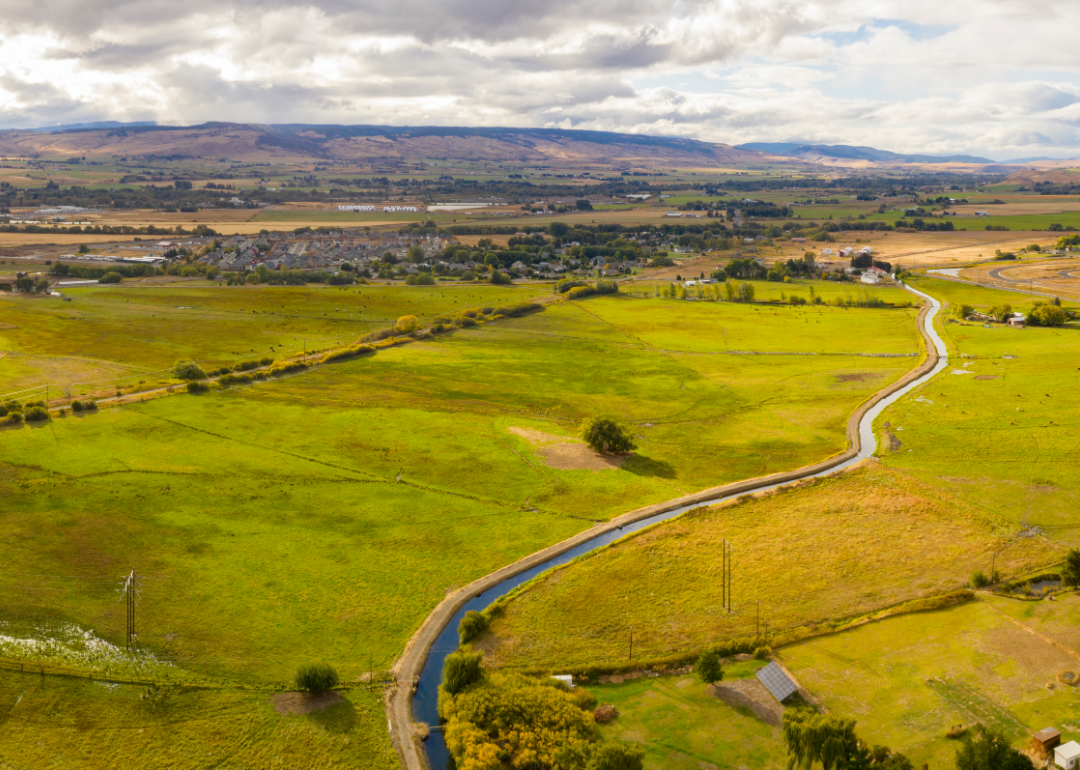
- Bridges in poor condition: 12.5% (39 of 311 bridges)
- Square meters of bridges in poor condition: 15.2% (24,865 of 163,842 square meters of bridges)
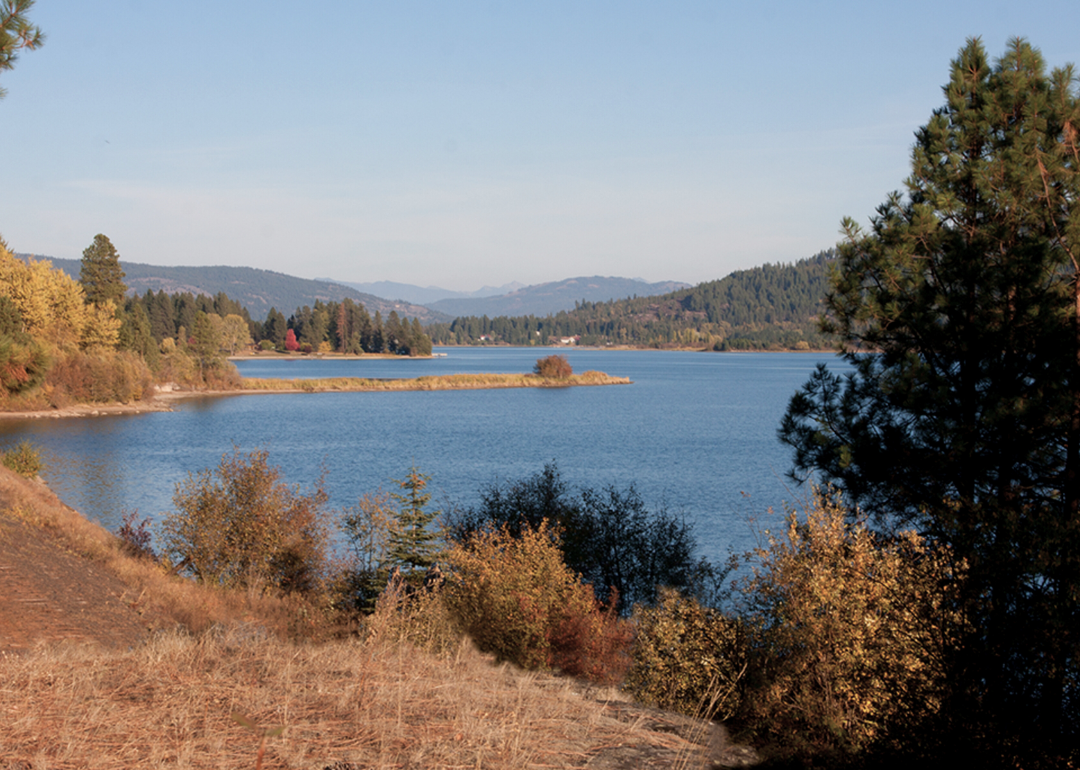
- Bridges in poor condition: 12.7% (9 of 71 bridges)
- Square meters of bridges in poor condition: 4.8% (1,063 of 22,319 square meters of bridges)
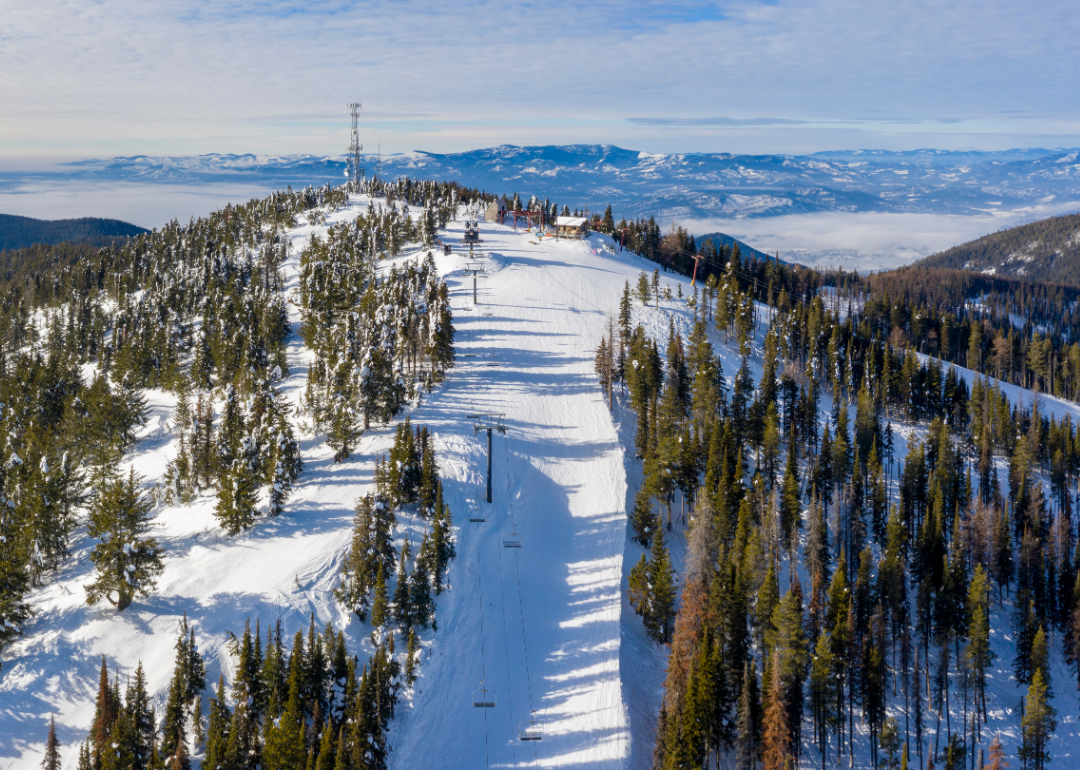
- Bridges in poor condition: 12.7% (9 of 71 bridges)
- Square meters of bridges in poor condition: 22.5% (5,316 of 23,631 square meters of bridges)
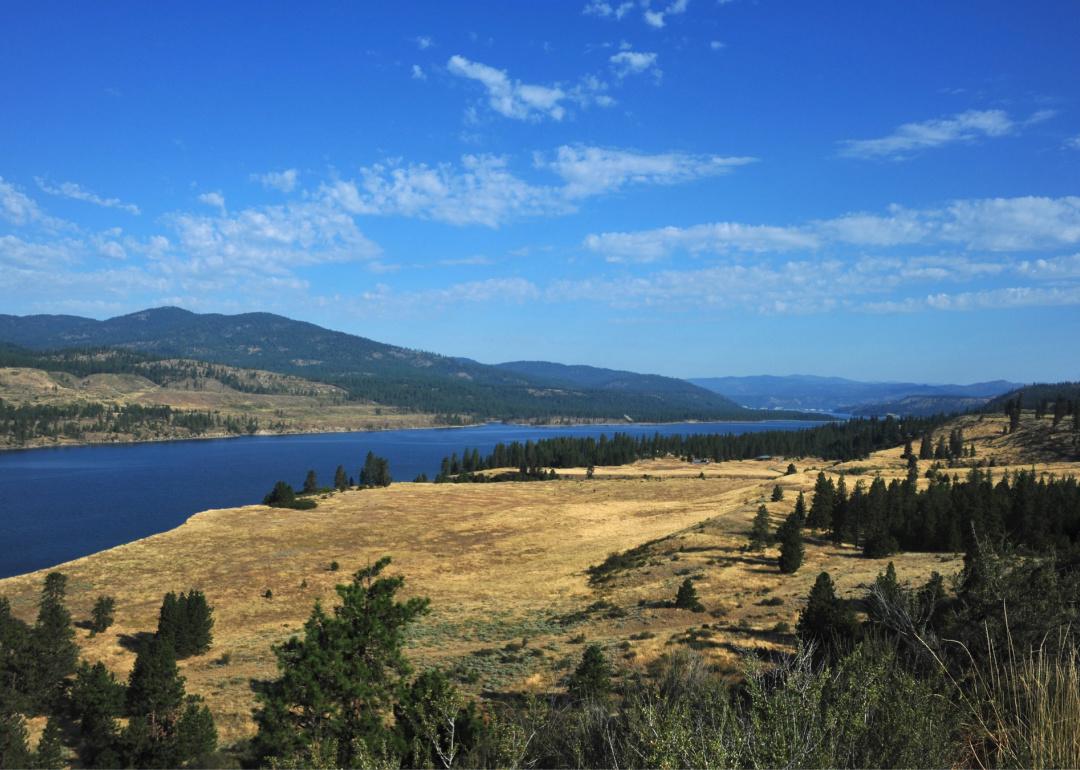
- Bridges in poor condition: 13.2% (7 of 53 bridges)
- Square meters of bridges in poor condition: 14.0% (1,308 of 9,336 square meters of bridges)
