Counties with the highest rates of strokes in New York

- Death rate for ischemic strokes, 2018-20: 14.2 per 100K people
- Death rate for hemorrhagic strokes, 2018-20: 7.0 per 100K people

- Death rate for ischemic strokes, 2018-20: 14.8 per 100K people
- Death rate for hemorrhagic strokes, 2018-20: 7.1 per 100K people

- Death rate for ischemic strokes, 2018-20: 16.3 per 100K people
- Death rate for hemorrhagic strokes, 2018-20: 7.9 per 100K people

- Death rate for ischemic strokes, 2018-20: 12.0 per 100K people
- Death rate for hemorrhagic strokes, 2018-20: 6.8 per 100K people

- Death rate for ischemic strokes, 2018-20: 14.0 per 100K people
- Death rate for hemorrhagic strokes, 2018-20: 6.7 per 100K people
You may also like: Best places to live in New York

- Death rate for ischemic strokes, 2018-20: 14.8 per 100K people
- Death rate for hemorrhagic strokes, 2018-20: 8.3 per 100K people

- Death rate for ischemic strokes, 2018-20: 14.9 per 100K people
- Death rate for hemorrhagic strokes, 2018-20: 6.2 per 100K people

- Death rate for ischemic strokes, 2018-20: 16.1 per 100K people
- Death rate for hemorrhagic strokes, 2018-20: 7.1 per 100K people

- Death rate for ischemic strokes, 2018-20: 16.1 per 100K people
- Death rate for hemorrhagic strokes, 2018-20: 7.7 per 100K people
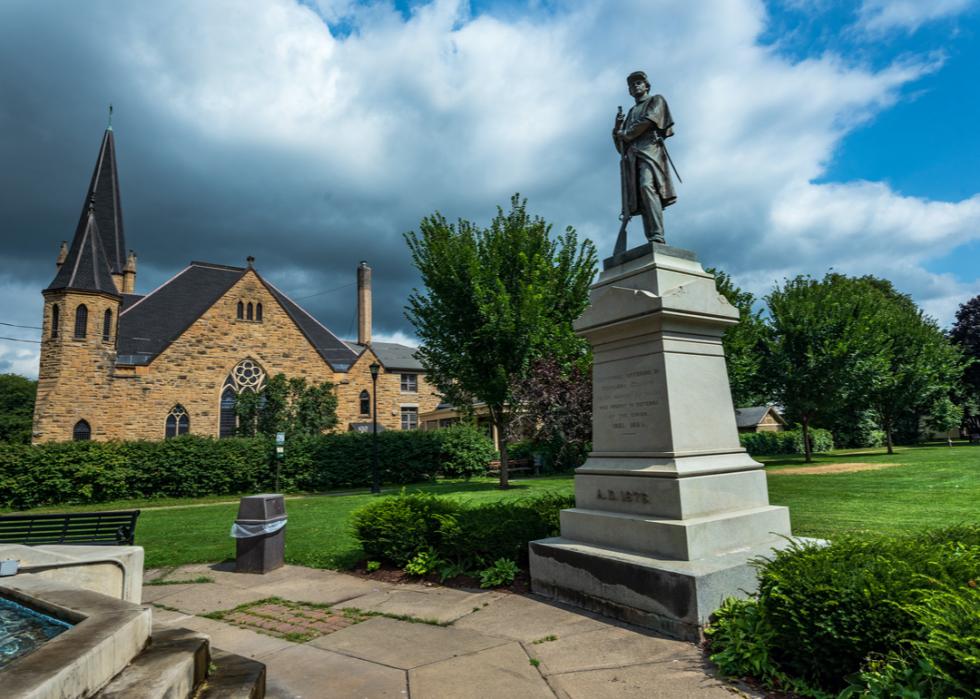
- Death rate for ischemic strokes, 2018-20: 16.1 per 100K people
- Death rate for hemorrhagic strokes, 2018-20: 7.9 per 100K people
You may also like: Highest-earning counties in New York

- Death rate for ischemic strokes, 2018-20: 16.6 per 100K people
- Death rate for hemorrhagic strokes, 2018-20: 7.9 per 100K people

- Death rate for ischemic strokes, 2018-20: 17.2 per 100K people
- Death rate for hemorrhagic strokes, 2018-20: 6.6 per 100K people

- Death rate for ischemic strokes, 2018-20: 17.2 per 100K people
- Death rate for hemorrhagic strokes, 2018-20: 6.7 per 100K people

- Death rate for ischemic strokes, 2018-20: 17.3 per 100K people
- Death rate for hemorrhagic strokes, 2018-20: 7.0 per 100K people
- Death rate for ischemic strokes, 2018-20: 17.4 per 100K people
- Death rate for hemorrhagic strokes, 2018-20: 7.5 per 100K people
You may also like: Counties with the lowest home prices in New York
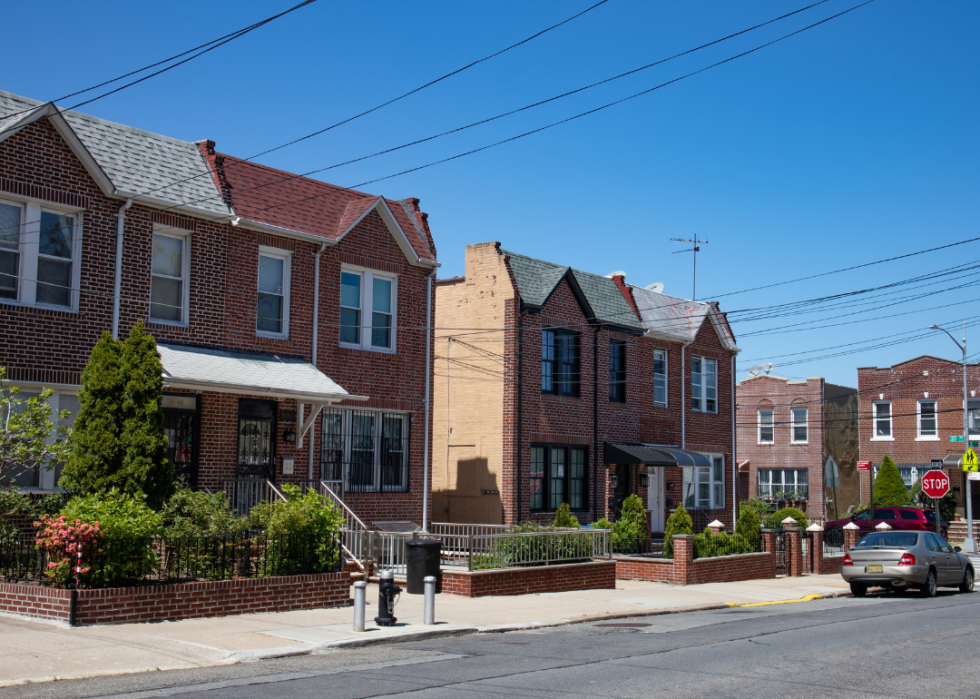
- Death rate for ischemic strokes, 2018-20: 9.1 per 100K people
- Death rate for hemorrhagic strokes, 2018-20: 6.6 per 100K people

- Death rate for ischemic strokes, 2018-20: 13.7 per 100K people
- Death rate for hemorrhagic strokes, 2018-20: 7.8 per 100K people

- Death rate for ischemic strokes, 2018-20: 13.8 per 100K people
- Death rate for hemorrhagic strokes, 2018-20: 7.4 per 100K people

- Death rate for ischemic strokes, 2018-20: 15.5 per 100K people
- Death rate for hemorrhagic strokes, 2018-20: 8.6 per 100K people
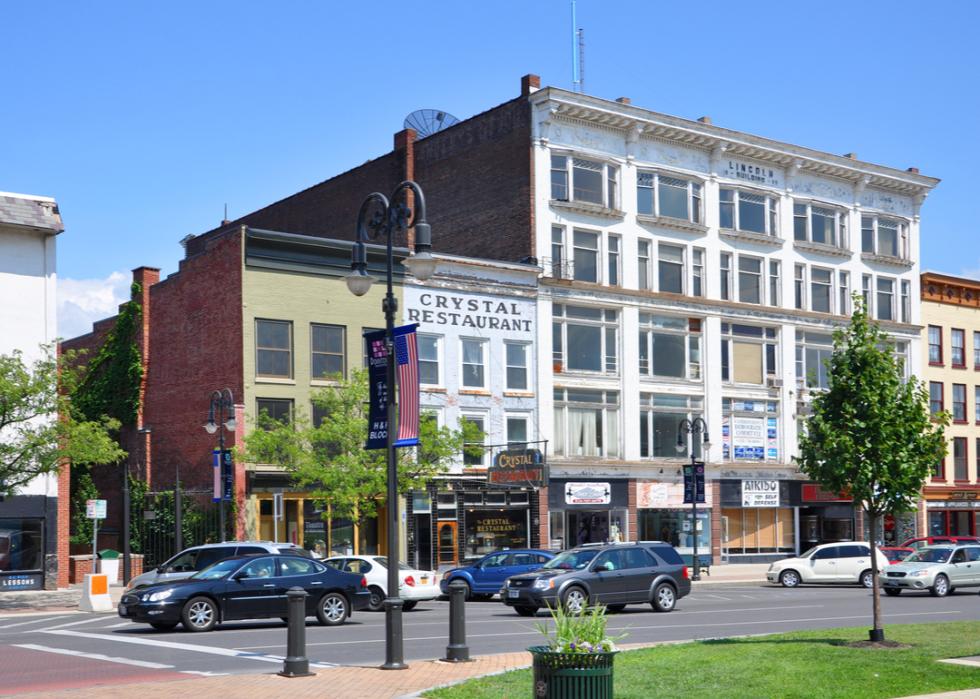
- Death rate for ischemic strokes, 2018-20: 16.4 per 100K people
- Death rate for hemorrhagic strokes, 2018-20: 8.6 per 100K people
You may also like: Colleges with the best ROI in New York

- Death rate for ischemic strokes, 2018-20: 17.1 per 100K people
- Death rate for hemorrhagic strokes, 2018-20: 7.6 per 100K people

- Death rate for ischemic strokes, 2018-20: 17.2 per 100K people
- Death rate for hemorrhagic strokes, 2018-20: 8.4 per 100K people

- Death rate for ischemic strokes, 2018-20: 17.4 per 100K people
- Death rate for hemorrhagic strokes, 2018-20: 9.2 per 100K people

- Death rate for ischemic strokes, 2018-20: 17.4 per 100K people
- Death rate for hemorrhagic strokes, 2018-20: 10.9 per 100K people

- Death rate for ischemic strokes, 2018-20: 14.7 per 100K people
- Death rate for hemorrhagic strokes, 2018-20: 7.2 per 100K people
You may also like: Best school districts in New York

- Death rate for ischemic strokes, 2018-20: 14.7 per 100K people
- Death rate for hemorrhagic strokes, 2018-20: 7.9 per 100K people
- Death rate for ischemic strokes, 2018-20: 14.8 per 100K people
- Death rate for hemorrhagic strokes, 2018-20: 8.5 per 100K people
- Death rate for ischemic strokes, 2018-20: 15.0 per 100K people
- Death rate for hemorrhagic strokes, 2018-20: 6.5 per 100K people
- Death rate for ischemic strokes, 2018-20: 15.7 per 100K people
- Death rate for hemorrhagic strokes, 2018-20: 10.6 per 100K people

- Death rate for ischemic strokes, 2018-20: 16.1 per 100K people
- Death rate for hemorrhagic strokes, 2018-20: 8.2 per 100K people
You may also like: Most popular boy names in the 80s in New York

- Death rate for ischemic strokes, 2018-20: 16.2 per 100K people
- Death rate for hemorrhagic strokes, 2018-20: 7.1 per 100K people

- Death rate for ischemic strokes, 2018-20: 16.2 per 100K people
- Death rate for hemorrhagic strokes, 2018-20: 9.6 per 100K people

- Death rate for ischemic strokes, 2018-20: 16.4 per 100K people
- Death rate for hemorrhagic strokes, 2018-20: 9.5 per 100K people
- Death rate for ischemic strokes, 2018-20: 16.8 per 100K people
- Death rate for hemorrhagic strokes, 2018-20: 7.0 per 100K people

- Death rate for ischemic strokes, 2018-20: 16.8 per 100K people
- Death rate for hemorrhagic strokes, 2018-20: 8.0 per 100K people
You may also like: What New York's immigrant population looked like in 1900

- Death rate for ischemic strokes, 2018-20: 16.9 per 100K people
- Death rate for hemorrhagic strokes, 2018-20: 7.9 per 100K people

- Death rate for ischemic strokes, 2018-20: 17.0 per 100K people
- Death rate for hemorrhagic strokes, 2018-20: 8.7 per 100K people

- Death rate for ischemic strokes, 2018-20: 18.9 per 100K people
- Death rate for hemorrhagic strokes, 2018-20: 6.9 per 100K people

- Death rate for ischemic strokes, 2018-20: 13.4 per 100K people
- Death rate for hemorrhagic strokes, 2018-20: 7.4 per 100K people

- Death rate for ischemic strokes, 2018-20: 13.8 per 100K people
- Death rate for hemorrhagic strokes, 2018-20: 7.5 per 100K people
You may also like: New York's climate has warmed by 1.98° F since 1970

- Death rate for ischemic strokes, 2018-20: 14.0 per 100K people
- Death rate for hemorrhagic strokes, 2018-20: 7.3 per 100K people

- Death rate for ischemic strokes, 2018-20: 14.3 per 100K people
- Death rate for hemorrhagic strokes, 2018-20: 8.1 per 100K people

- Death rate for ischemic strokes, 2018-20: 14.6 per 100K people
- Death rate for hemorrhagic strokes, 2018-20: 8.0 per 100K people

- Death rate for ischemic strokes, 2018-20: 16.9 per 100K people
- Death rate for hemorrhagic strokes, 2018-20: 7.5 per 100K people
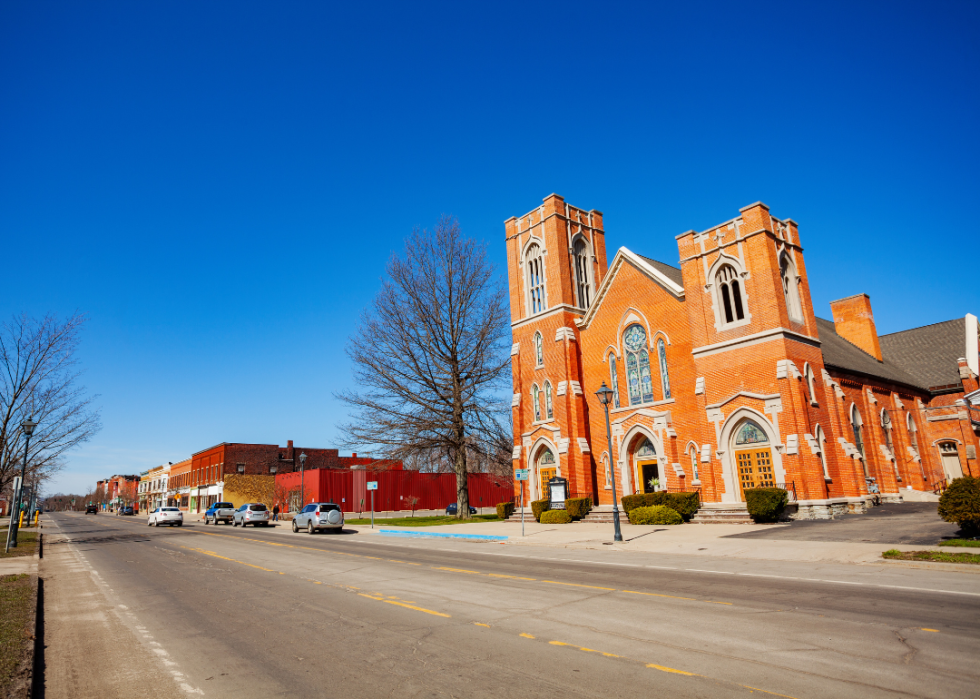
- Death rate for ischemic strokes, 2018-20: 18.4 per 100K people
- Death rate for hemorrhagic strokes, 2018-20: 8.6 per 100K people
You may also like: Counties with the oldest homes in New York
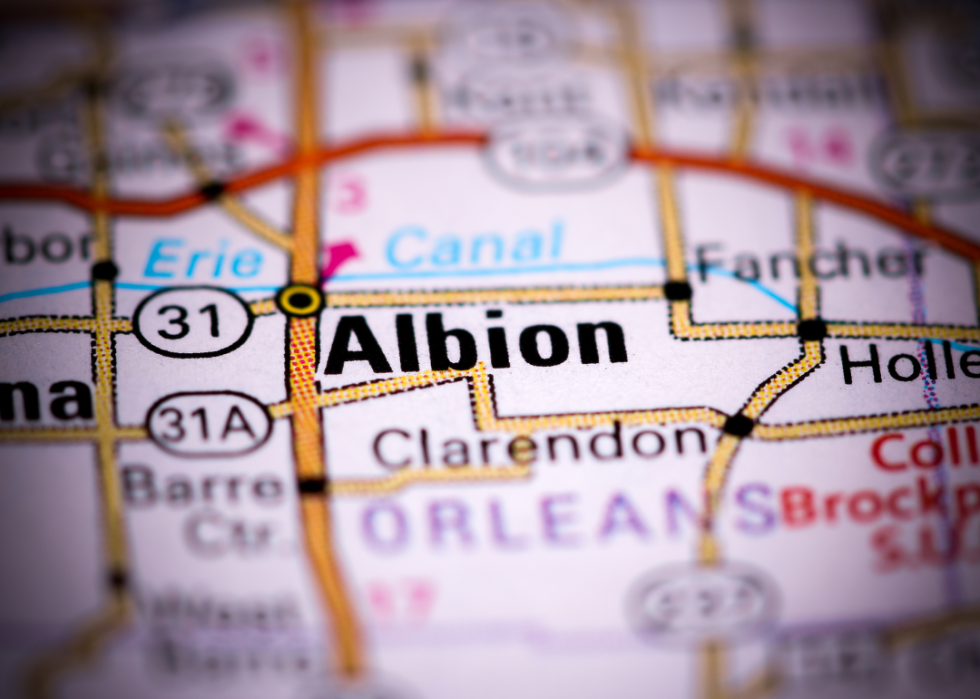
- Death rate for ischemic strokes, 2018-20: 17.3 per 100K people
- Death rate for hemorrhagic strokes, 2018-20: 8.0 per 100K people

- Death rate for ischemic strokes, 2018-20: 17.5 per 100K people
- Death rate for hemorrhagic strokes, 2018-20: 8.8 per 100K people

- Death rate for ischemic strokes, 2018-20: 8.9 per 100K people
- Death rate for hemorrhagic strokes, 2018-20: 6.3 per 100K people

- Death rate for ischemic strokes, 2018-20: 15.3 per 100K people
- Death rate for hemorrhagic strokes, 2018-20: 8.0 per 100K people

- Death rate for ischemic strokes, 2018-20: 11.2 per 100K people
- Death rate for hemorrhagic strokes, 2018-20: 7.3 per 100K people
You may also like: New York is the #6 state where delivery drivers are paid the most
This story features data reporting and writing by Emma Rubin and is part of a series utilizing data automation across 49 states.
